
 ( click to enlarge )
NVIDIA Corporation (NASDAQ:NVDA) is in a strong bull Market. The stock hit a new all-time high on Friday, making a run and breaking the psychological level of $200 and out of a consolidation pattern. All key technical daily indicators are in bullish zones, but showing some negative divergences by failing to touch new highs with the stock. Let's see if stock will sustain next week this movement. Keep NVDA in your watchlist.
 ( click to enlarge )
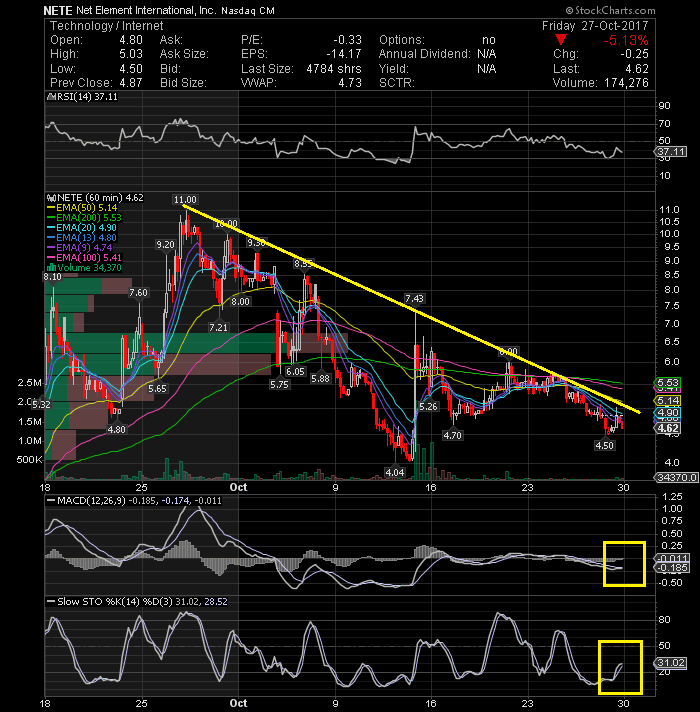
Net Element International Inc (NASDAQ:NETE) has been beaten down since the last week of September, but at this moment it seems pretty clear that buyers have been waiting in the 4.5-5 range to enter again. The stock looks like is starting to turn back up and some key indicators are giving the first bullish signs. The Stochastic Oscillator is registering a bullish signal as the %K has crossed above the %D and the MACD is rising slowly. The stock needs to close above $4.9 on a daily basis in order to mitigate the negative near-term view. With a huge short interest versus its tiny float this stock can move very fast, with larger swings. I started a position in NETE Friday.
 ( click to enlarge )
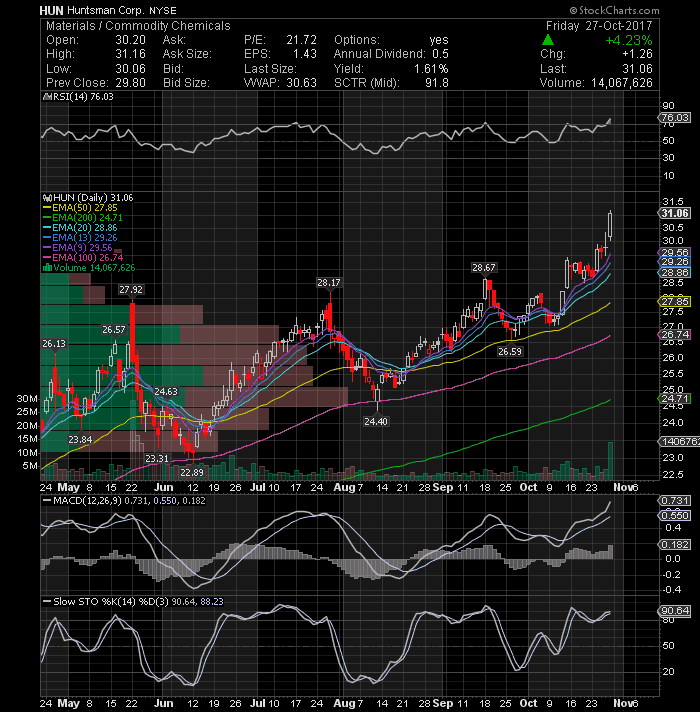
Huntsman Corporation (NYSE:HUN) broke out to a new all-time high Friday, accompanied by a good volume suggesting higher levels. This stock has been in a nice uptrend for the last five weeks and it looks very strong with all EMAs going up. HUN is now on the overbought level, so this means a possible correction is near. Pullbacks to 29.50 are buyable.
 ( click to enlarge )
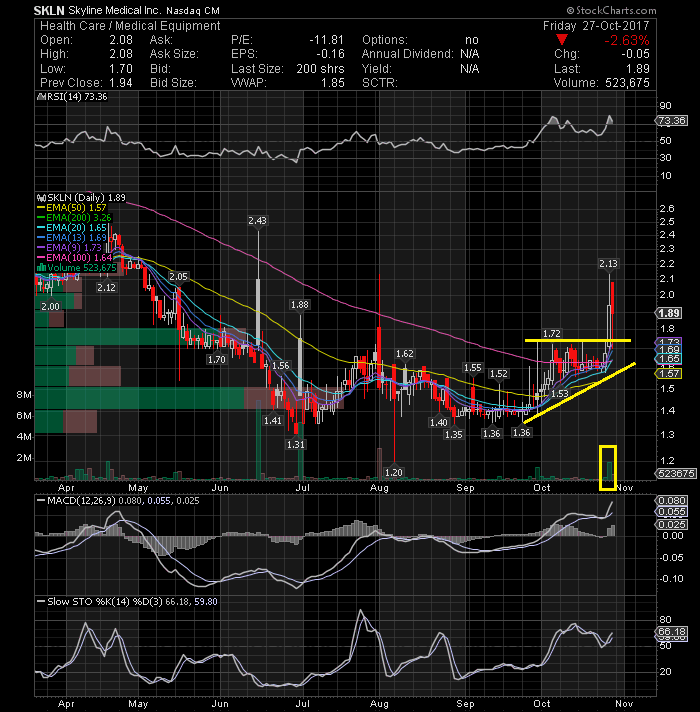
Skyline Medical Inc (NASDAQ:SKLN) Massive high volume spike on Thursday, breaking out of a month consolidation (ascending triangle pattern). The stock could make another push for $2.4-2.5 without much resistance. Technical Indicators are supporting the bulls. Another low float stock on High alert.
 ( click to enlarge )
Tandem Diabetes Care Inc (NASDAQ:TNDM) Insiders and institutions have been buying a lot of shares in recent weeks, which indicates that they are bullish about the company's ability to recover. The daily chart looks like it is forming a similar bottom pattern as it did in August. Based on the recent insider activity and pattern, i continue to believe the stock has a lot of room to run. Frankly speaking, it is deeply undervalued at current levels. For some reason, institutions purchased more than 2 Million shares in the last two weeks. The company float is just 9M shares.
 ( click to enlarge )
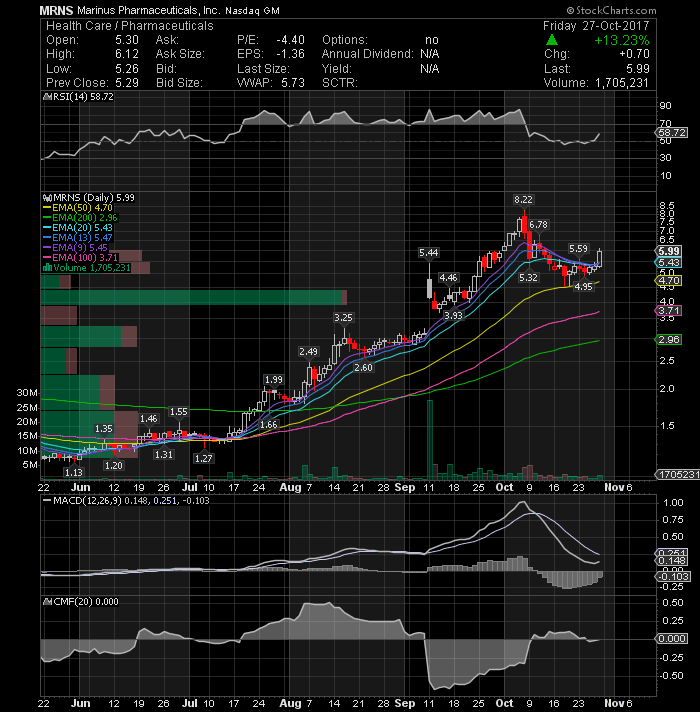
Marinus Pharmaceuticals Inc (NASDAQ:MRNS) made a strong upside reversal on Friday, printing a nice bullish engulfing candle on strong volume and I expect a pop above 6.50 at some point next week. Stop 4.95
 ( click to enlarge )
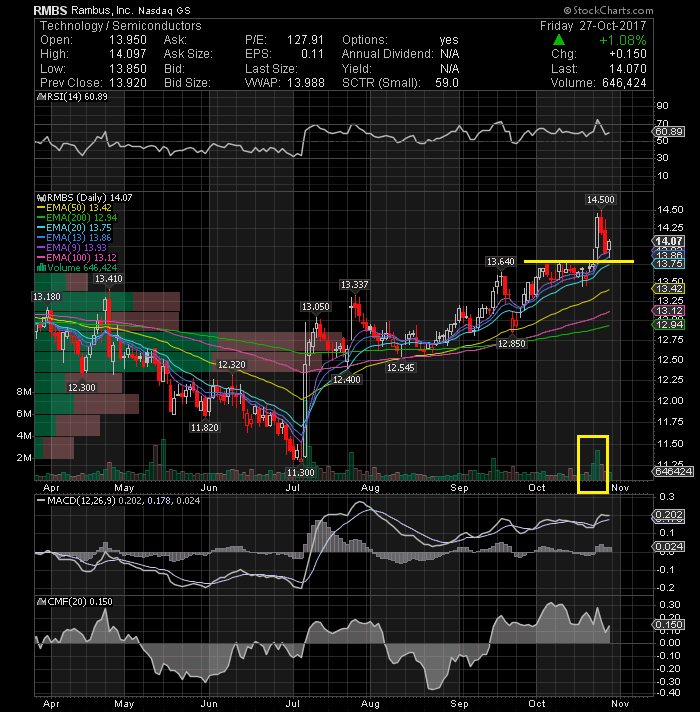
Rambus Inc. (NASDAQ:RMBS) Great run last week on very strong volume surge. Typical pullback on Wednesday and Thursday after a strong breakout. Stock has not traded at this level since August 2016. Let's see if the price can hold above this key support area next week and move higher. The outlook remains positive supported by the EMAs and momentum indicators.
 ( click to enlarge )
Izea Inc (NASDAQ:IZEA) An upside break of this falling wedge on high relative volume would signal a shift in momentum. If this pattern does break out towards the upside it could easily push the price towards the red rectangle shown on the chart.
 ( click to enlarge )
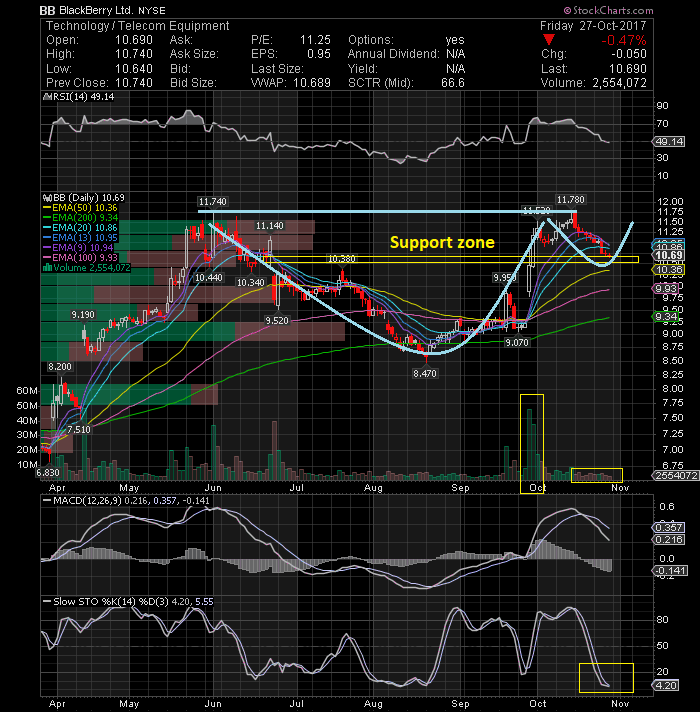
BlackBerry Ltd (NYSE:BB) has been pulling back on very low volume. Time to look for a reversal. Long-term chart shows a possible Cup and Handle formation.
During the day I tweet many times to my readers. I encourage everybody to subscribe AC Investor Blog twitter and newsletter, so you can receive my trade ideas and stock news in real time.
Disclaimer : This is not an investment advisory, and should not be used to make investment decisions. Information in AC Investor Blog is often opinionated and should be considered for information purposes only. No stock exchange anywhere has approved or disapproved of the information contained herein. There is no express or implied solicitation to buy or sell securities. The charts provided here are not meant for investment purposes and only serve as technical examples. Don't consider buying or selling any stock without conducting your own due diligence.
Thanks for visiting AC Investor Blog.
AC
