I don’t sugarcoat things. So let’s be clear: while risk is just risk until price action follows through to the downside, it will take quite a change of circumstances to stop small-cap stocks from plummeting from here.
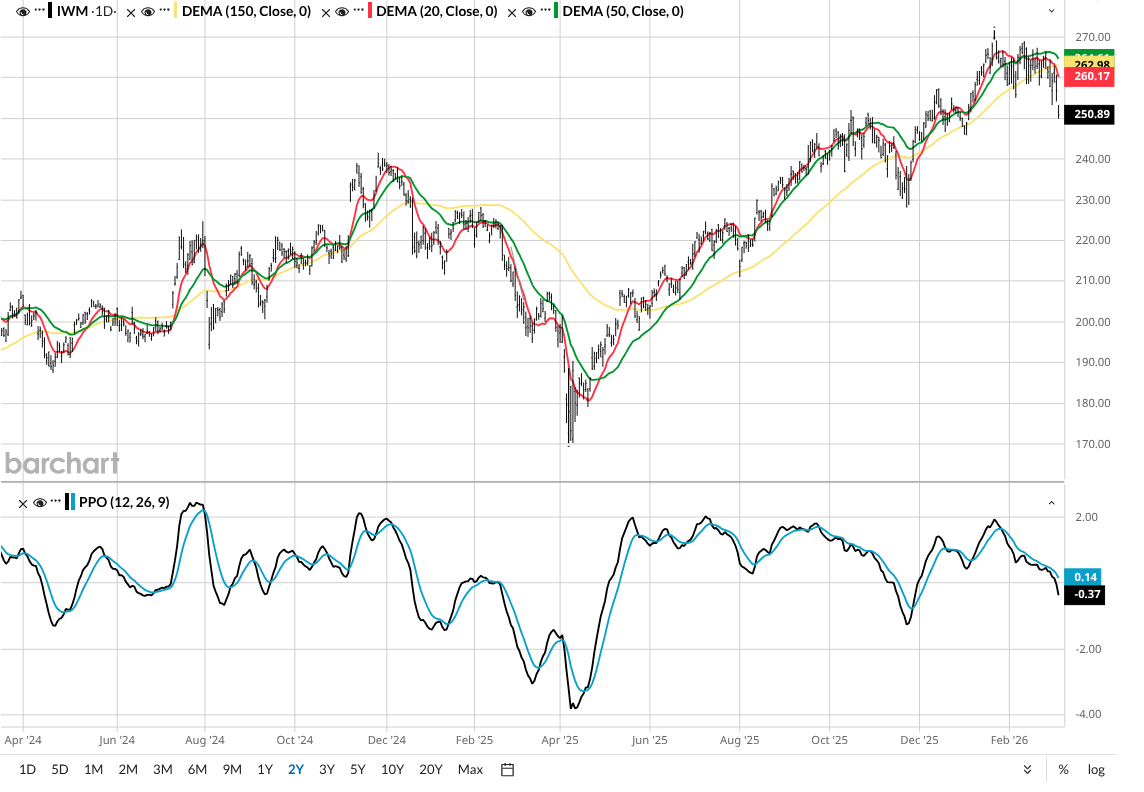
This is about as vulnerable a chart as I’ve seen in a while. It has all the makings of a move down toward the August lows around $210. And if it doesn’t burn all its bear fuel by then, last April’s $170 bottom is in play. That’s a breezy one-third off Friday’s close.
So to me, the surge in unusual options activity for the iShares Russell 2000 ETF (IWM) is less of a surprise and more of a confirmation for those who have long viewed small-caps as structural laggards. As of Friday’s close, Barchart.com’s unusual options activity page is highlighting a massive spike in put volume that suggests the “smart money” is no longer treating IWM as a dormant value play, but is instead preparing for a significant technical breakdown. And I say, it’s about time!
You see, the core problem with IWM is that it has become a no-alpha asset class that consistently fails to justify its higher volatility. When the market is at its best, IWM often only manages to rival the returns of the Invesco S&P 500 Equal Weight ETF (RSP), which offers a similar diversification benefit without the exposure to thousands of companies that lack the potency of the micro-cap space.
For investors seeking true small-cap growth, funds targeting even smaller-cap stocks can often offer a more pure play, leaving IWM trapped in a middle ground where it captures all the downside of a weak market with very little of the upside of a high-conviction rally. I recently added the iShares Micro-Cap ETF (IWC) to my core portfolio of 10 ETFs that I rotate among.
Why Are Small-Cap Stocks So Risky Right Now?
From a fundamental perspective, the plight of IWM is compounded by its sector mix, which tilts toward healthcare and industrials, sectors that have faced a structural drag compared to the tech-heavy giants of the S&P 500 Index. In an environment where persistent inflation remains a concern, these smaller firms often face higher borrowing costs and deeper drawdowns during market shifts. The rapidly deteriorating technical picture is the final piece of the bearish puzzle.
IWM has recently experienced significant downward pressure, falling more than 2% in a single session to close at 250.89 last Friday, March 6. The increased put volume is a clear signal that the market is finally seeing what I have believed for a while: When the tide goes out, IWM is the first to leave investors stranded.
Specifically, the following unusual IWM put options, highlighted in yellow on either side of those 2 SPY contracts, are currently in the spotlight for their popularity:
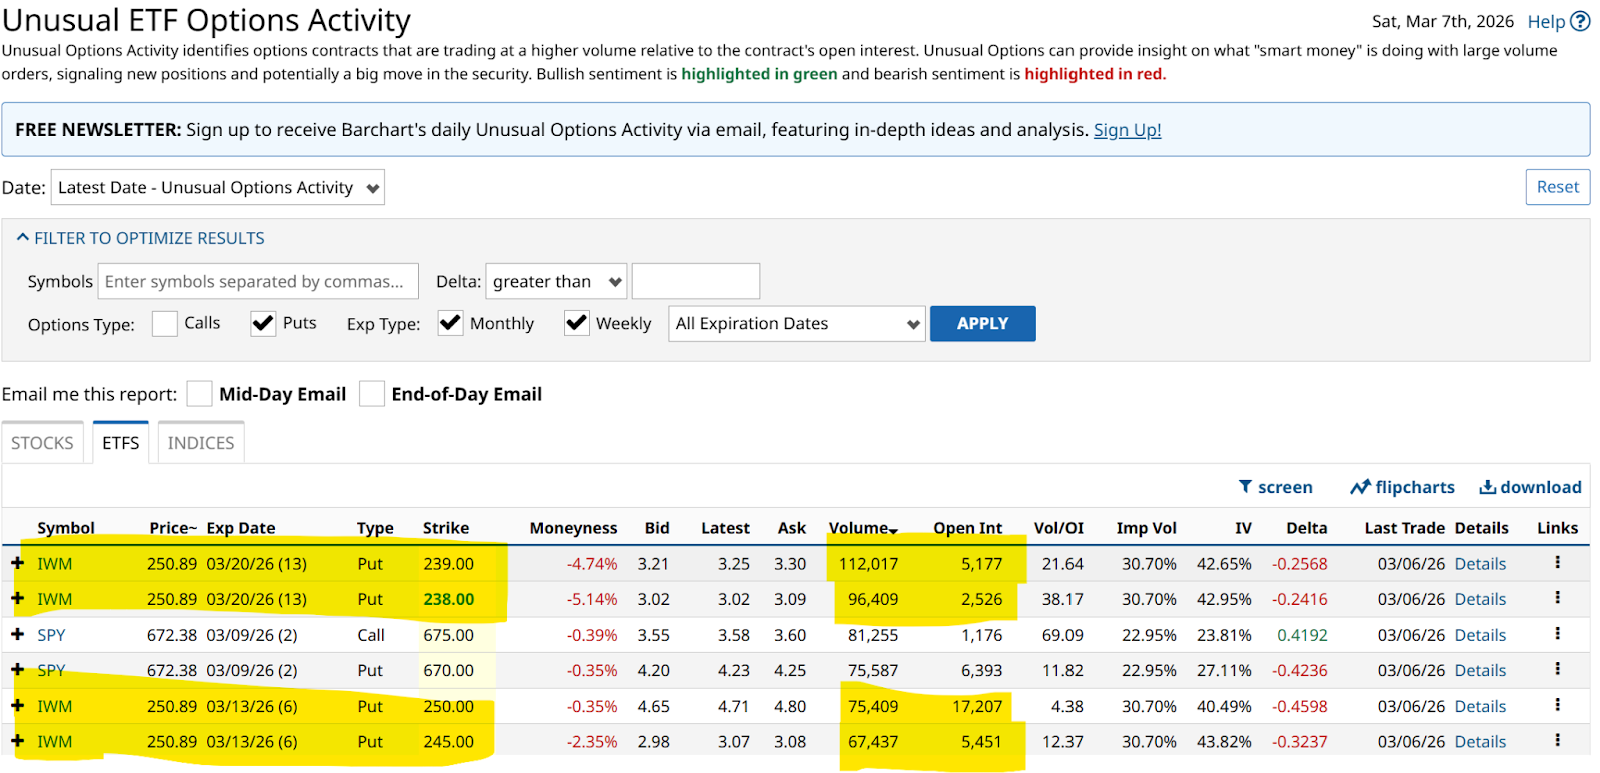
- Strike 238.00 (Exp 03/20/26): Showing an extreme Volume to Open Interest (Vol/OI) ratio of 38, with volume exceeding 96,000 against an open interest of just 2,526.
- Strike 239.00 (Exp 03/20/26): Recording a Vol/OI ratio of 22, with massive volume of 112,017 compared to an open interest of 5,177.
- Strike 245.00 (Exp 03/13/26): Carrying a Vol/OI ratio of 12.4, as volume reached 67,437 against 5,451 open interest.
- Strike 250.00 (Exp 03/13/26): Seeing a Vol/OI ratio of 4.4, with 75,409 in volume against 17,207 open interest.
With momentum indicators turning negative and institutional hedges piling up, these puts rightfully command attention as primary tools for those betting on continued small-cap underperformance.
Now, those options highlighted above are very short term. But this article is about “unusual” activity, not the normal activity I’d expect to see if IWM starts to fade further. Namely, that all put contracts will find an aggressive bid, as the hopes of “this time is different” falter.
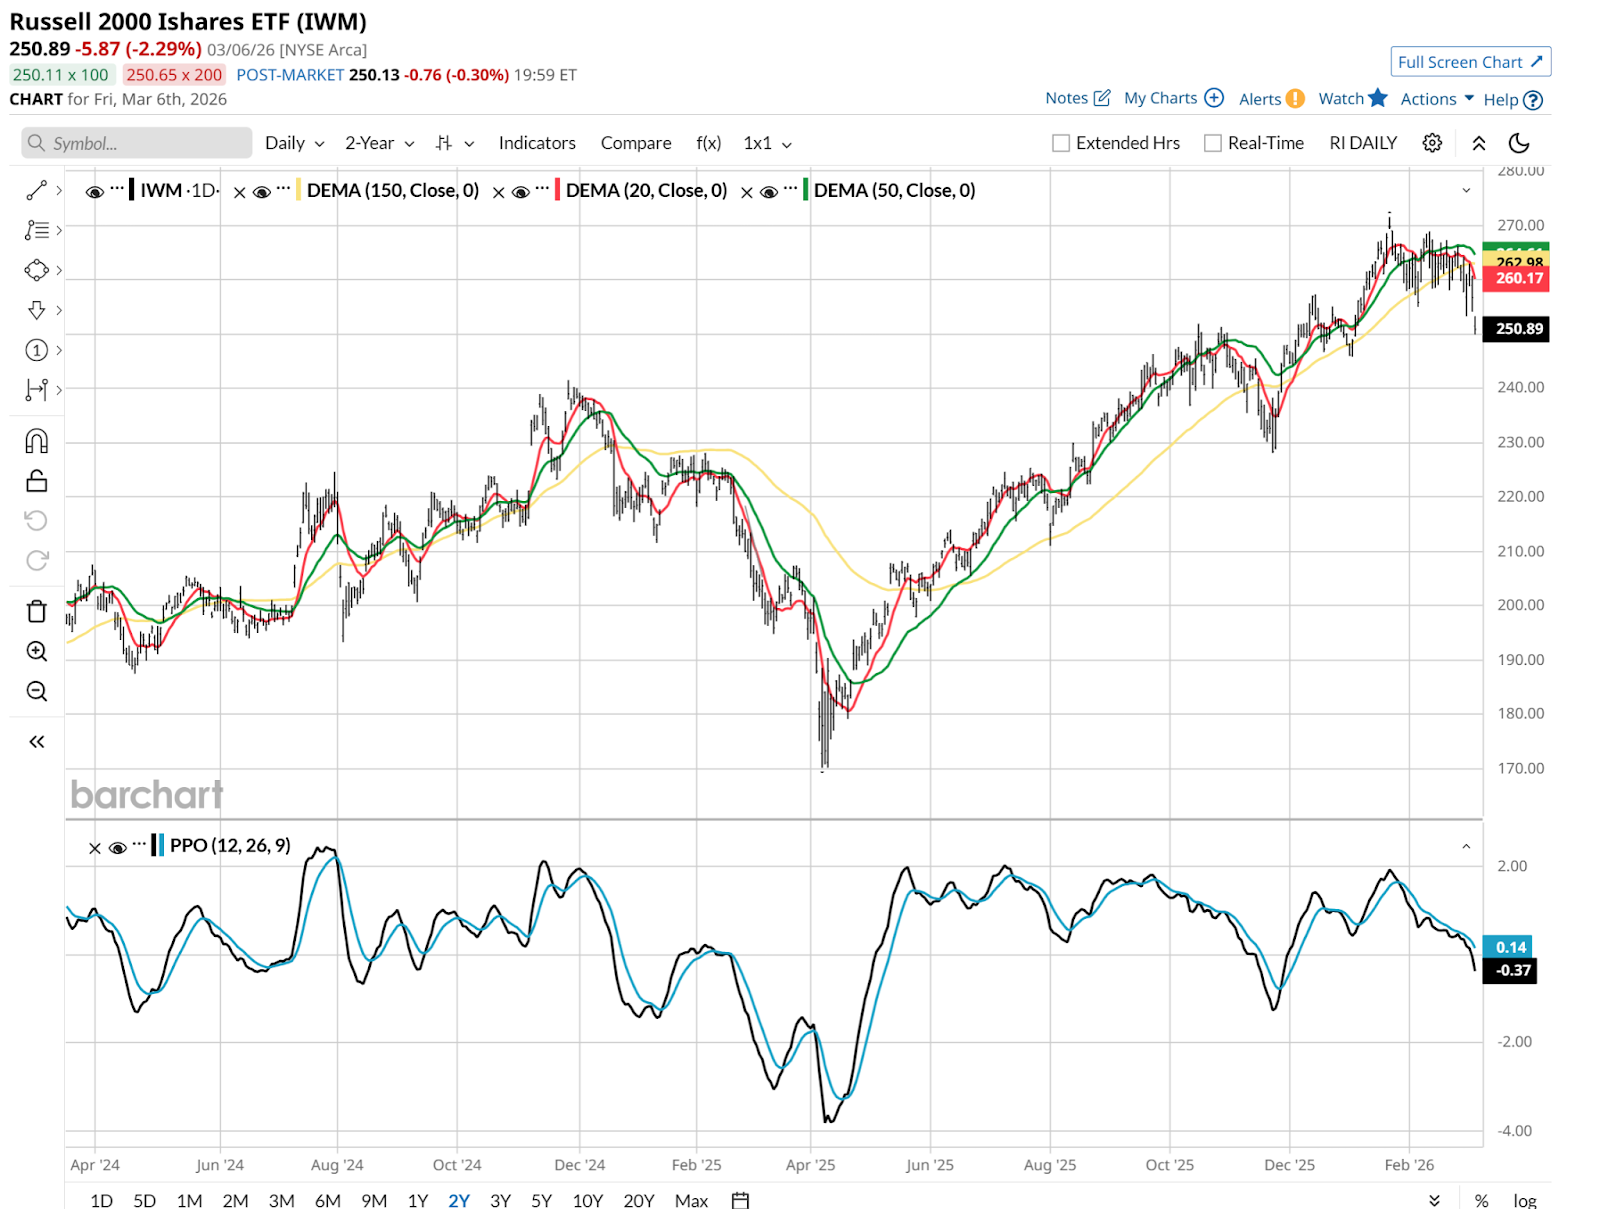
That’s just a really bad chart above. Moving averages tipped over, the percentage price oscillator (PPO) crossing down through zero, and the shape of that PPO line screams “getting worse” due to the increased downside angle late last week.
With volatility around 30 at the close of last week, this might be a case where I spend the first part of this week trying to “take big shots with small amounts of money,” one of my trading mantras. Those 3/20/26 $238 puts would fit the bill. They are not cheap, for sure. But I’ve found this year that once the horse leaves the proverbial barn, even above-average volatility can reward put buyers for a little while.
Rob Isbitts created the ROAR Score, based on his 40+ years of technical analysis experience. ROAR helps DIY investors manage risk and create their own portfolios. For Rob's written research, check out ETFYourself.com.
On the date of publication, Rob Isbitts did not have (either directly or indirectly) positions in any of the securities mentioned in this article. All information and data in this article is solely for informational purposes. For more information please view the Barchart Disclosure Policy here.
More news from Barchart