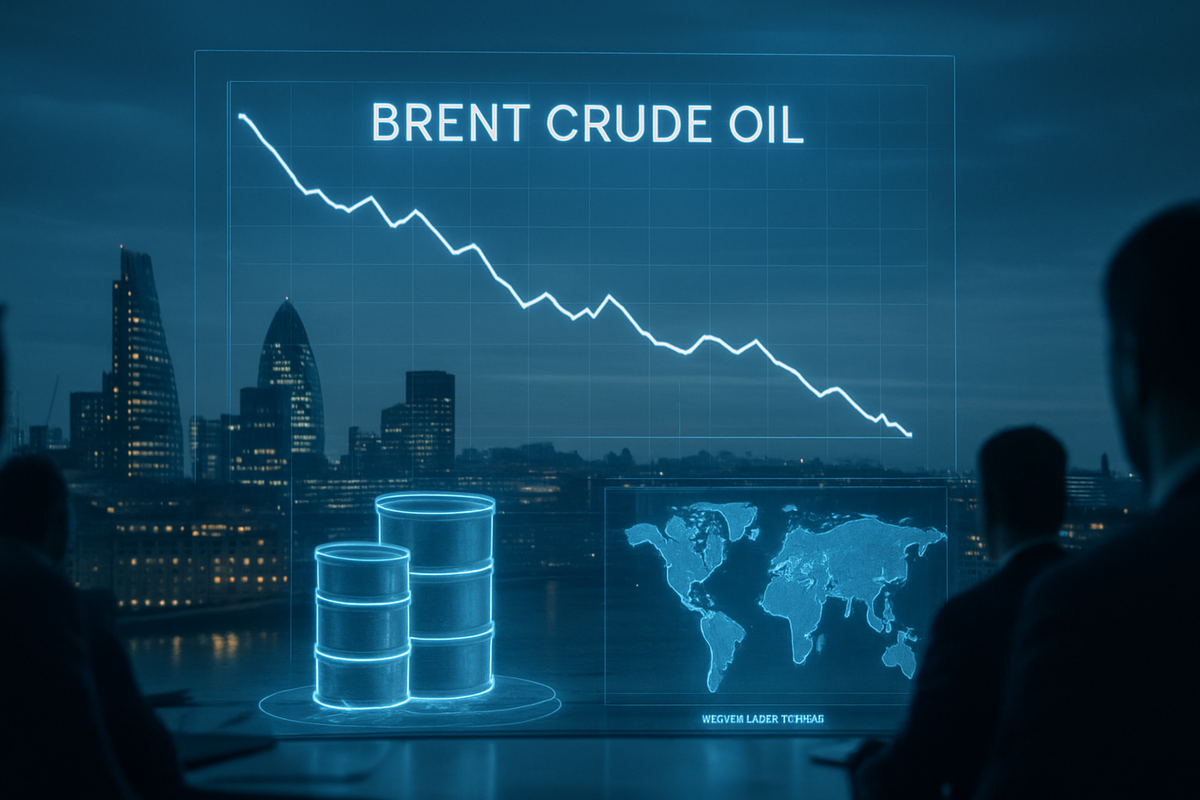
As delegates and energy titans gather in London for the 2026 International Energy Week (IE Week), the mood has shifted from the supply-security anxieties of years past to a starker, more bearish reality. A new consensus has emerged among top analysts and institutional forecasters, placing the outlook for Brent Crude oil squarely in the $55 to $65 per barrel range for the remainder of the year. This shift marks a significant departure from the volatility of the early 2020s, driven by a projected "super glut" where global production—fueled largely by a resilient U.S. shale machine—is expected to significantly outpace a cooling global demand.
The immediate implications for the market are profound. The traditional "geopolitical risk premium," which once added $10 to $20 to the price of a barrel, has been severely eroded by the sheer volume of spare capacity and record inventories. Even as tensions in the Middle East simmer and naval activities around Iran increase, traders are increasingly viewing these as temporary disruptions rather than structural threats. For the global economy, the prospect of sub-$60 oil offers a disinflationary tailwind, but for the energy sector, it signals a period of intense capital discipline and a fight for survival among high-cost producers.
Structural Bearishness Dominates the London Stage
The proceedings at IE Week 2026 have been dominated by data from the International Energy Agency (IEA) and the U.S. Energy Information Administration (EIA), both of which have updated their models to reflect a widening gap between supply and demand. As of February 11, 2026, the data suggests a global surplus of 3 to 4 million barrels per day (bpd). This imbalance stems from a two-pronged development: anemic demand growth of less than 1 million bpd, largely due to the accelerating adoption of electric vehicles and increased energy efficiency in China, and a relentless surge in output from non-OPEC+ nations.
The timeline leading to this "structural bearishness" can be traced back to the aggressive technological deployments in the Permian Basin during 2024 and 2025. While analysts initially expected U.S. production to plateau, the implementation of "simul-fracing" and ultra-long lateral wells has pushed U.S. output to record highs of 13.8 million bpd. Key players at the London conference, including representatives from Goldman Sachs and J.P. Morgan, have lowered their average 2026 Brent forecasts to $56 and $58 respectively, citing the inability of OPEC+ to effectively manage the market without ceding even more market share.
Initial market reactions to these forecasts have been swift. On the second day of the conference, Brent Crude fell 3.5%, breaking below the psychological $65 support level as traders realized that even a recent spike to $71—triggered by a U.S. naval buildup near the Strait of Hormuz—was unsustainable. The prevailing sentiment among the London delegates is that the market is now "volatility-designed" rather than "crisis-managed," meaning the floor for oil is no longer set by OPEC’s policy but by the marginal cost of the least efficient shale driller.
Winners and Losers in a $60 World
In this lower-for-longer price environment, the energy sector is splitting into two camps: the efficiency leaders and the high-cost laggards. ExxonMobil (NYSE: XOM) and Chevron (NYSE: CVX) appear well-positioned to weather the storm. Both companies have spent the last two years aggressively high-grading their portfolios, focusing on low-breakeven assets in Guyana and the Delaware Basin. With breakeven costs estimated to be below $35 per barrel in their core holdings, these integrated majors can continue to fund dividends and buybacks even if Brent averages $55.
Conversely, independent exploration and production (E&P) firms with higher debt loads or less productive acreage face significant headwinds. Companies like Ovintiv (NYSE: OVV) and certain smaller operators in the Bakken and Eagle Ford formations are seeing their margins compressed. Similarly, oilfield service giants like SLB (NYSE: SLB) and Halliburton (NYSE: HAL) may face a slowdown in demand as producers prioritize "maintenance-level" drilling over expansion. If Brent remains below $60 for an extended period, these service providers may be forced to lower their day rates, further impacting their 2026 revenue targets.
The refining sector presents a more nuanced picture. While lower feedstock costs for crude oil are generally positive for companies like Marathon Petroleum (NYSE: MPC) and Phillips 66 (NYSE: PSX), these benefits are often offset by weakening demand for end products like gasoline and diesel. During the IE Week sessions, refiners noted that while their "crack spreads" remain healthy for now, the surplus of refined products in the Atlantic Basin could lead to inventory builds that ultimately suppress refining margins by the third quarter of 2026.
The Broader Impact: Geopolitics vs. Fundamentals
The current outlook for 2026 highlights a fascinating evolution in the relationship between energy and geopolitics. Historically, a threat involving Iran or the Middle East would have sent oil prices into a parabolic ascent. However, the "Atlantic Basin Triad"—comprising the U.S., Brazil, and Guyana—has fundamentally shifted the world’s supply center of gravity. This diversification of supply has created a buffer that makes the global economy more resilient to shocks in the Persian Gulf.
This event fits into a broader industry trend of "de-carbonization via economics." As renewable energy and battery storage continue to drop in price, the ceiling for oil prices is being lowered by the competitive threat of alternative fuels. The current surplus is not just a result of overproduction, but a signal of "peak oil demand" appearing on the horizon faster than many expected in the previous decade. Regulators in the EU and the U.S. are also tightening methane and carbon emission standards, adding a "carbon cost" that effectively acts as a tax on high-cost, high-emission barrels, further incentivizing the shift toward more efficient producers.
Comparing 2026 to the 2014-2016 oil price crash, there are notable differences. In 2014, the crash was largely driven by a price war initiated by OPEC to kill off the nascent U.S. shale industry. In 2026, the lower price is more a function of technological success and shifting consumer behavior. Unlike 2014, today’s major oil companies are far more disciplined, having spent years repairing their balance sheets, which suggests they will not engage in a "race to the bottom" but will instead let high-cost production naturally fall off the curve.
Looking Ahead: The Pivot to Capital Discipline
In the short term, the market will likely see a period of "drilling for cash, not growth." Most E&P companies, including Diamondback Energy (NASDAQ: FANG) and Coterra Energy (NYSE: CTRA), are expected to pivot their strategies toward maximizing free cash flow and returning it to shareholders rather than trying to out-produce the global surplus. This strategic adaptation is essential for maintaining investor interest in a sector that is increasingly competing with high-growth technology stocks for capital.
Over the long term, the market may see a wave of consolidation. If Brent Crude remains suppressed between $55 and $65 throughout 2026, the "M&A" (mergers and acquisitions) fever that characterized 2024 and 2025 is likely to continue as larger players seek to acquire low-cost reserves from distressed smaller competitors. Market opportunities may emerge in the transition space, as companies like Shell (SHEL) and BP (BP) use the cash flows from their low-cost oil assets to accelerate their investments in power markets and hydrogen, hedge against a permanent decline in crude prices.
The potential scenarios for the latter half of 2026 hinge on whether OPEC+ decides to implement a massive, coordinated production cut to floor the price. However, current indications from IE Week suggest that Saudi Arabia and its allies are wary of losing more market share to the U.S. and Brazil. A "status quo" scenario, where the market remains oversupplied and prices fluctuate in the $50s, remains the most likely outcome for the year ahead.
Conclusion: A New Baseline for the Energy Markets
The 2026 IE Week in London has crystallized what many in the industry had feared: the era of high-priced oil has likely concluded for the foreseeable future. The consensus of $55–$65 Brent is a reflection of a world where technology has unlocked vast reserves and consumer habits have begun to shift away from fossil fuels. The primary takeaway for investors and stakeholders is that the "war premium" is no longer a reliable driver of price; instead, the focus must be on cost-per-barrel and operational efficiency.
Moving forward, the market will be defined by its ability to absorb a 3-4 million bpd surplus. While geopolitical flare-ups in the Middle East involving Iran may provide temporary trading opportunities, the underlying fundamentals suggest a ceiling that is difficult to break. Investors should watch for the Q1 and Q2 earnings calls of the major shale producers to see if they stick to their promises of production discipline or if the temptation to gain market share leads to even deeper price declines.
Ultimately, the significance of the 2026 outlook lies in its permanence. This is not a temporary dip, but a re-balancing of the global energy order. The "Golden Age of Shale" has matured into a "Silver Age of Efficiency," where the survivors will be those who can operate profitably in the $50 range while navigating an increasingly complex regulatory and geopolitical landscape.
This content is intended for informational purposes only and is not financial advice.