Railcar products and services provider Trinity (NYSE: TRN) reported revenue ahead of Wall Street’s expectations in Q4 CY2025, but sales fell by 2.9% year on year to $611.2 million. Its GAAP profit of $2.28 per share was in line with analysts’ consensus estimates.
Is now the time to buy Trinity? Find out by accessing our full research report, it’s free.
Trinity (TRN) Q4 CY2025 Highlights:
- Revenue: $611.2 million vs analyst estimates of $570.5 million (2.9% year-on-year decline, 7.1% beat)
- EPS (GAAP): $2.28 vs analyst estimates of $2.28 (in line)
- Adjusted EBITDA: $417.1 million vs analyst estimates of $393.8 million (68.2% margin, 5.9% beat)
- EPS (GAAP) guidance for the upcoming financial year 2026 is $1.98 at the midpoint, beating analyst estimates by 23.4%
- Operating Margin: 54.9%, up from 14.7% in the same quarter last year
- Free Cash Flow was -$60.4 million compared to -$21.6 million in the same quarter last year
- Backlog: $1.7 billion at quarter end, down 19% year on year
- Market Capitalization: $2.54 billion
“Trinity Industries delivered strong full year 2025 results with an EPS of $3.14 – an improvement of $1.33 year over year – driven by higher lease rates, gains on lease portfolio sales, lower administrative costs, and a $194 million non-cash gain from a railcar partnership restructuring,” said Jean Savage, Trinity’s Chief Executive Officer and President.
Company Overview
Operating under the trade name TrinityRail, Trinity (NYSE: TRN) is a provider of railcar products and services in North America.
Revenue Growth
Reviewing a company’s long-term sales performance reveals insights into its quality. Any business can put up a good quarter or two, but the best consistently grow over the long haul. Over the last five years, Trinity grew its sales at a sluggish 4.3% compounded annual growth rate. This was below our standard for the industrials sector and is a poor baseline for our analysis.
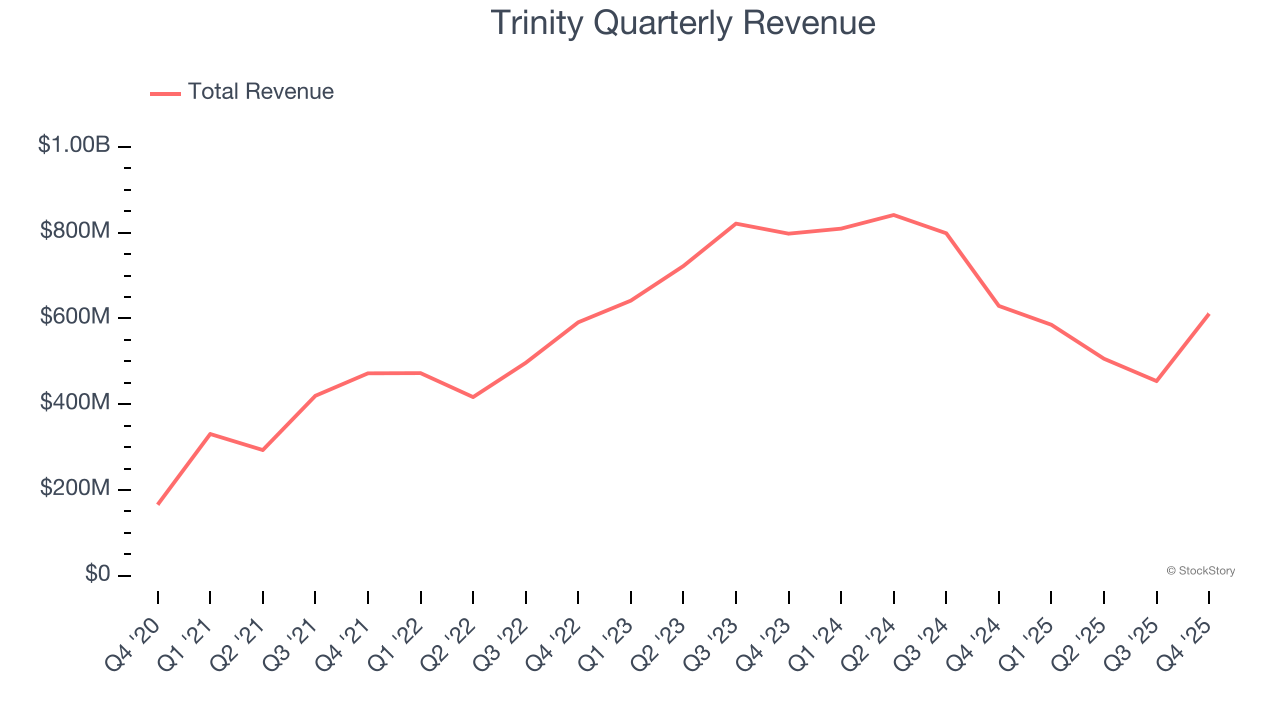
We at StockStory place the most emphasis on long-term growth, but within industrials, a half-decade historical view may miss cycles, industry trends, or a company capitalizing on catalysts such as a new contract win or a successful product line. Trinity’s performance shows it grew in the past but relinquished its gains over the last two years, as its revenue fell by 15% annually. Trinity isn’t alone in its struggles as the Heavy Transportation Equipment industry experienced a cyclical downturn, with many similar businesses observing lower sales at this time. 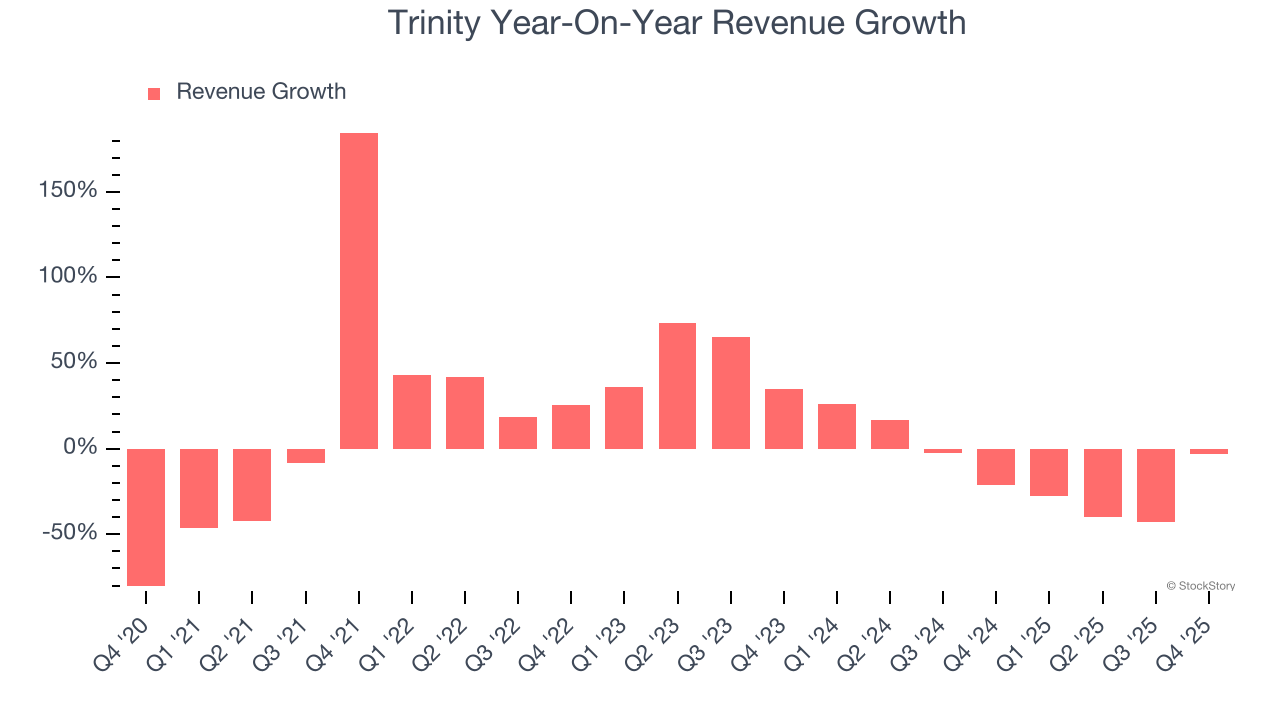
We can dig further into the company’s revenue dynamics by analyzing its backlog, or the value of its outstanding orders that have not yet been executed or delivered. Trinity’s backlog reached $1.7 billion in the latest quarter and averaged 27.8% year-on-year declines over the last two years. Because this number is lower than its revenue growth, we can see the company hasn’t secured enough new orders to maintain its growth rate in the future. 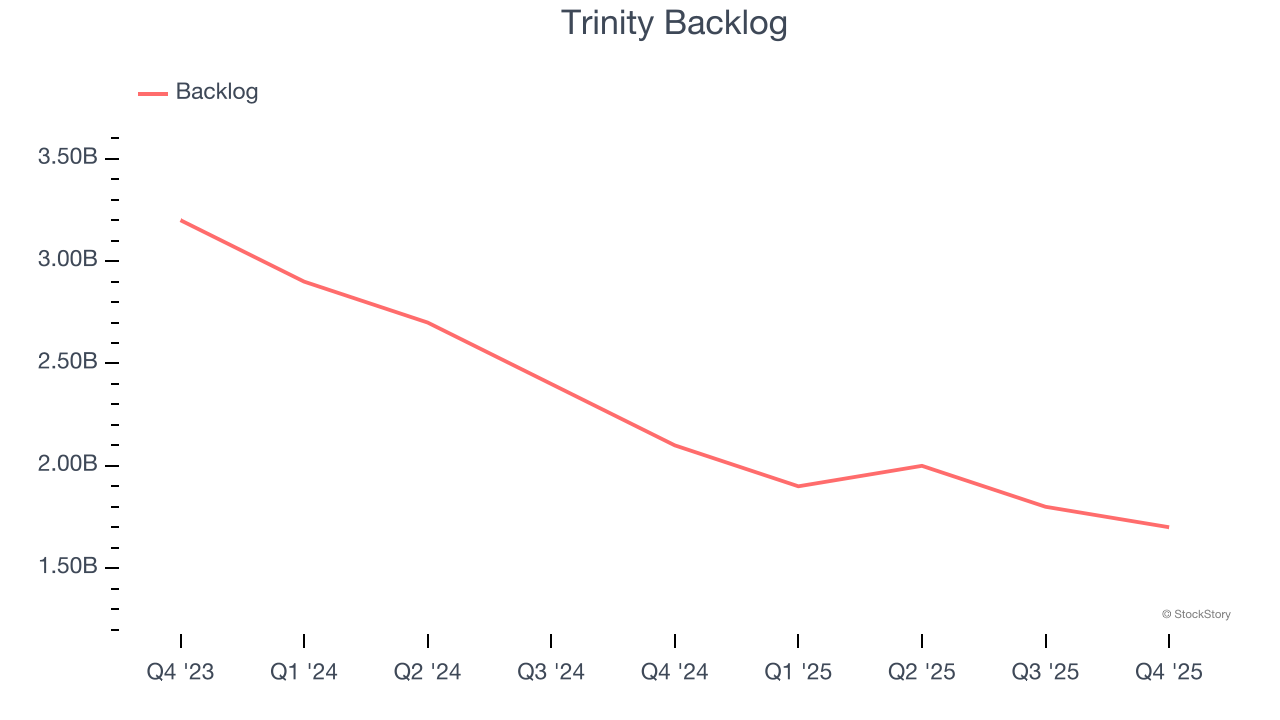
This quarter, Trinity’s revenue fell by 2.9% year on year to $611.2 million but beat Wall Street’s estimates by 7.1%.
Looking ahead, sell-side analysts expect revenue to remain flat over the next 12 months. While this projection implies its newer products and services will fuel better top-line performance, it is still below average for the sector.
The 1999 book Gorilla Game predicted Microsoft and Apple would dominate tech before it happened. Its thesis? Identify the platform winners early. Today, enterprise software companies embedding generative AI are becoming the new gorillas. a profitable, fast-growing enterprise software stock that is already riding the automation wave and looking to catch the generative AI next.
Operating Margin
Operating margin is an important measure of profitability as it shows the portion of revenue left after accounting for all core expenses – everything from the cost of goods sold to advertising and wages. It’s also useful for comparing profitability across companies with different levels of debt and tax rates because it excludes interest and taxes.
Trinity has been an efficient company over the last five years. It was one of the more profitable businesses in the industrials sector, boasting an average operating margin of 14.7%. This result was particularly impressive because of its low gross margin, which is mostly a factor of what it sells and takes huge shifts to move meaningfully. Companies have more control over their operating margins, and it’s a show of well-managed operations if they’re high when gross margins are low.
Analyzing the trend in its profitability, Trinity’s operating margin rose by 16.7 percentage points over the last five years, as its sales growth gave it operating leverage.
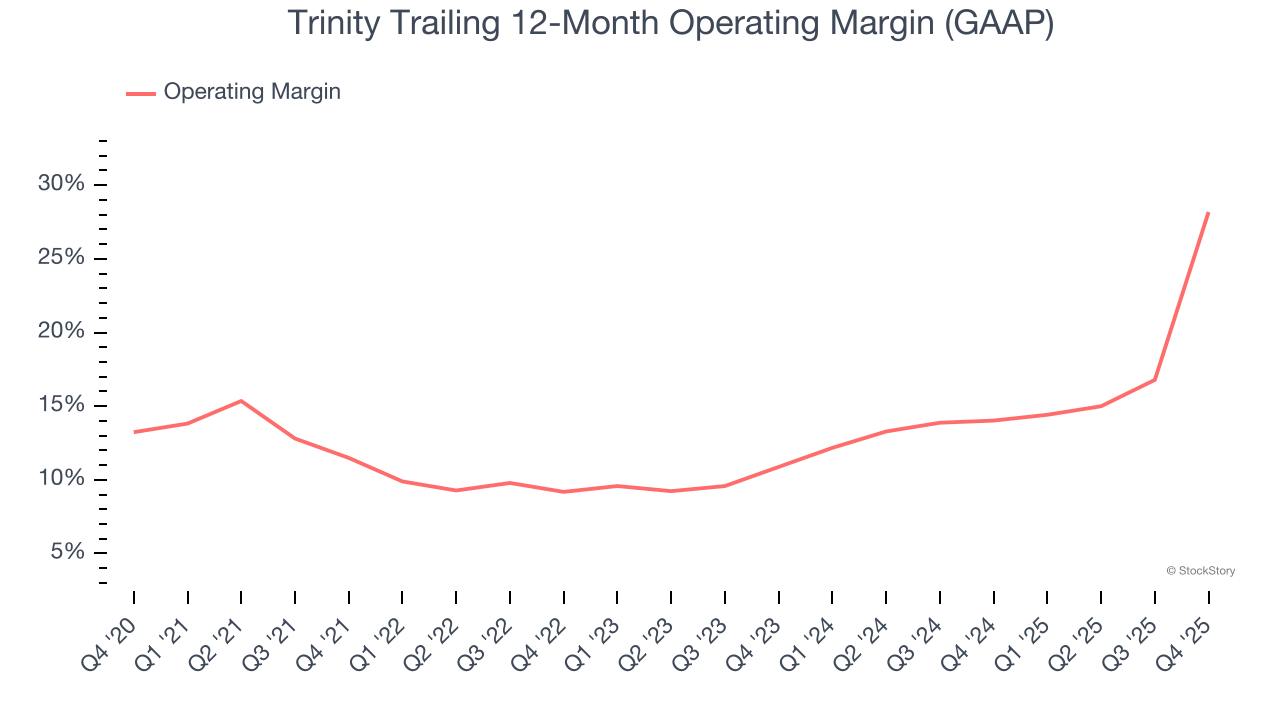
In Q4, Trinity generated an operating margin profit margin of 54.9%, up 40.1 percentage points year on year. The increase was solid, and because its operating margin rose more than its gross margin, we can infer it was more efficient with expenses such as marketing, R&D, and administrative overhead.
Earnings Per Share
We track the long-term change in earnings per share (EPS) for the same reason as long-term revenue growth. Compared to revenue, however, EPS highlights whether a company’s growth is profitable.
Trinity’s full-year EPS flipped from negative to positive over the last five years. This is encouraging and shows it’s at a critical moment in its life.
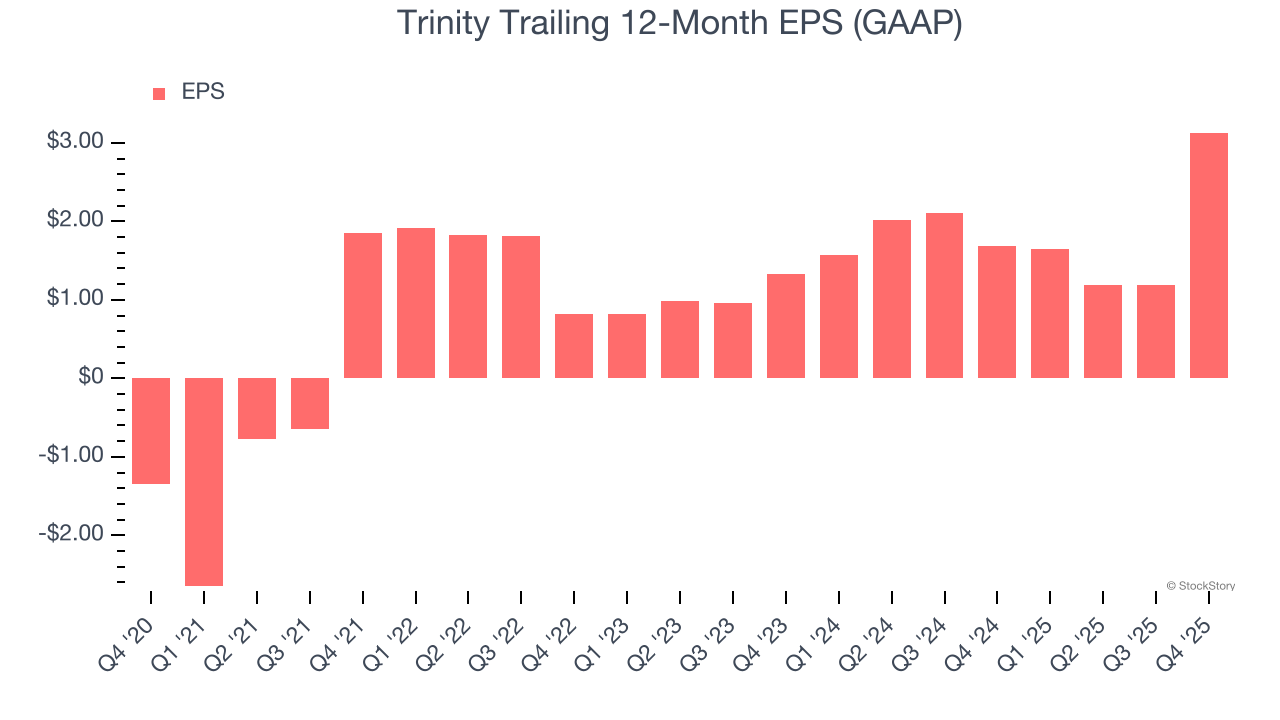
Like with revenue, we analyze EPS over a shorter period to see if we are missing a change in the business.
Trinity’s EPS grew at an astounding 53.4% compounded annual growth rate over the last two years, higher than its 15% annualized revenue declines. This tells us management adapted its cost structure in response to a challenging demand environment.
We can take a deeper look into Trinity’s earnings quality to better understand the drivers of its performance. Trinity’s operating margin has expanded over the last two yearswhile its share count has shrunk 2%. Improving profitability and share buybacks are positive signs for shareholders as they juice EPS growth relative to revenue growth. 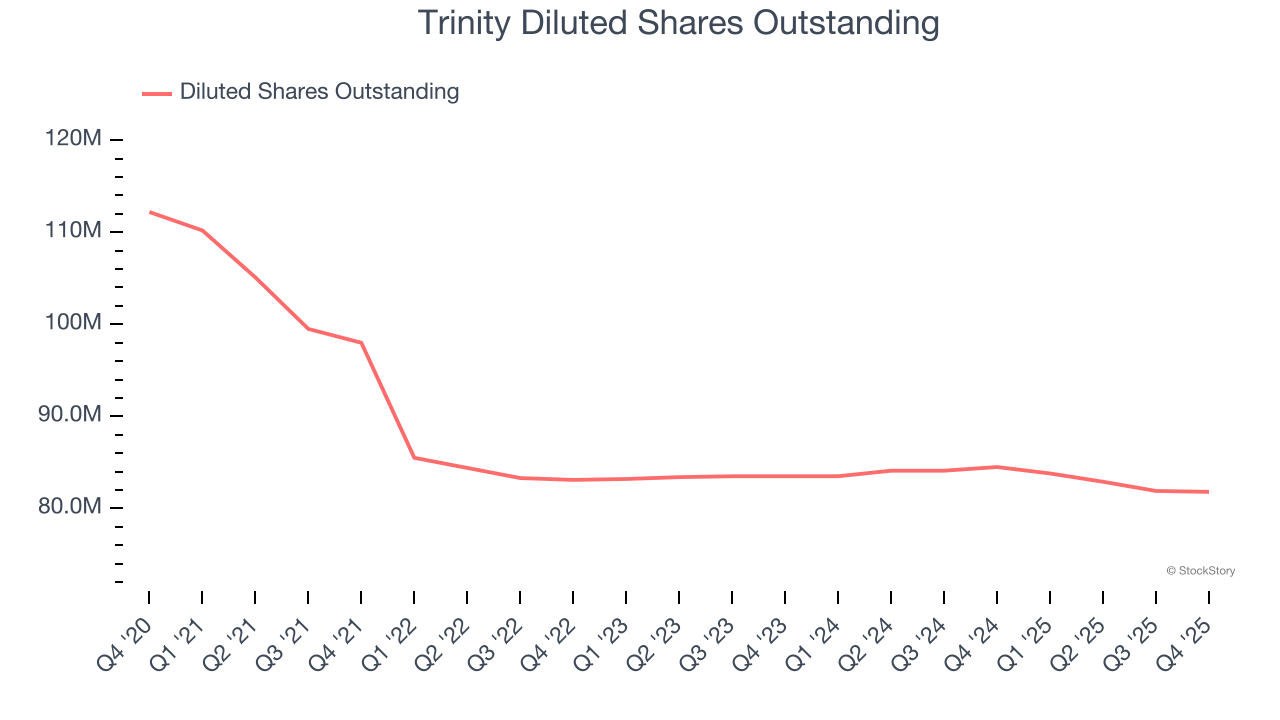
In Q4, Trinity reported EPS of $2.28, up from $0.34 in the same quarter last year. This print was close to analysts’ estimates. We also like to analyze expected EPS growth based on Wall Street analysts’ consensus projections, but there is insufficient data.
Key Takeaways from Trinity’s Q4 Results
We were impressed by how significantly Trinity blew past analysts’ revenue expectations this quarter. We were also glad its full-year EPS guidance trumped Wall Street’s estimates. Zooming out, we think this was a solid print. The stock traded up 6.8% to $33.83 immediately following the results.
Sure, Trinity had a solid quarter, but if we look at the bigger picture, is this stock a buy? The latest quarter does matter, but not nearly as much as longer-term fundamentals and valuation, when deciding if the stock is a buy. We cover that in our actionable full research report which you can read here (it’s free).