
Truckload freight volumes fell last month and national benchmark spot rates for dry van and refrigerated (“reefer”) loads retreated from their gains in June, reported DAT Freight & Analytics, which operates the industry’s largest online freight marketplace and DAT iQ data analytics service.
This press release features multimedia. View the full release here: https://www.businesswire.com/news/home/20230818042461/en/
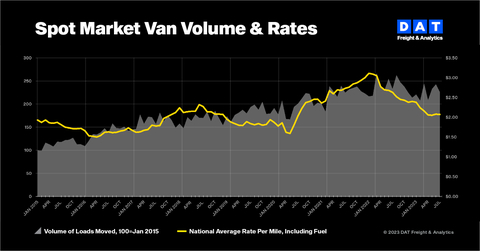
July freight volumes and rates chilled by seasonality (Graphic: DAT Freight & Analytics)
The DAT Truckload Volume Index (TVI), a measure of loads moved during a given month, was lower in July for all three equipment types:
- Van TVI was 226, down 7.0% from June and 3.0% lower year-over-year.
- Reefer TVI slipped to 169, 3.4% lower than in June but 1.2% higher year-over-year.
- Flatbed TVI was 238, 12.8% lower compared to June but 3.5% higher year-over-year.
“Shippers faced service disruptions at the ports and in the less-than-truckload sector but were able to secure van capacity without causing the needle to move on spot rates and volumes,” said Ken Adamo, Chief of Analytics.
Despite month-over-month declines, the reefer and flatbed TVI numbers were the highest on record for July as fresh and frozen food, metals, machinery, construction materials and other seasonal freight moved through supply chains.
Demand for trucks slowed
National average load-to-truck ratios for van and reefer freight have been virtually unchanged for three straight months:
- The van ratio was 2.6, equal to June and down from 3.8 in July 2022.
- The reefer ratio was 3.8 - unchanged from June and down from 7.2 a year earlier.
- The flatbed ratio was 7.1, down from 9.7 in June and significantly down from 21.8 in July 2022.
Spot, contract rates dipped
Reflecting flat demand, DAT’s benchmark spot rates slipped in July:
- The spot van rate was $2.07 per mile, down 1 cent compared to June and 56 cents lower than in July 2022.
- The spot reefer rate dipped 3 cents to $2.44 per mile and 60 cents lower year-over-year.
- The spot flatbed rate was $2.54 a mile, down 7 cents month over month and 72 cents lower year-over-year.
Line-haul rates, which subtract an amount equal to a fuel surcharge, declined as well. DAT’s benchmark van line-haul rate was $1.63 per mile, down 2 cents compared to June. The reefer line-haul rate fell 5 cents to $1.96 per mile and the flatbed line-haul rate dropped 9 cents to $2.01 per mile.
The average fuel surcharge increased by 2 cents to an average of 44 cents a mile for van freight, 48 cents for reefers and 53 cents for flatbeds in July.
“Spot rates, as a reminder, are ‘all-in’ rates, meaning no separate fuel surcharge to help mitigate the risk of fuel price fluctuations. You have to negotiate each individual load with fuel and operating costs in mind, which is not always easy,” Adamo said. “The sudden increase in fuel prices is testing the wherewithal of small carriers at a time when freight volumes are in a seasonal lull.”
DAT’s benchmark rates for contracted freight strengthened compared to pricing on the spot market. The van rate fell 1 cent to $2.57 a mile, the reefer rate gained 3 cents to $2.91 a mile and the flatbed rate rose 5 cents to $3.29 a mile.
After closing for three straight months, the spread between contract and spot rates was unchanged for van freight and increased by 6 cents for reefers and 12 cents for flatbed loads. The size of the gap is an indicator of bargaining power among shippers, brokers and carriers, Adamo explained.
About the DAT Truckload Volume Index
The DAT Truckload Volume Index reflects the change in the number of loads with a pickup date during that month; the actual index number is normalized each month to accommodate any new data sources without distortion. A baseline of 100 equals the number of loads moved in January 2015, as recorded in DAT RateView, a truckload pricing database and analysis tool with rates paid on an average of 3 million loads per month.
Spot truckload rates are negotiated for each load and paid to the carrier by a freight broker. DAT benchmark rates are derived from payments to carriers by freight brokers, third-party logistics providers and other transportation buyers for hauls of 250 miles or more with a pickup date during the month reported. DAT’s rate analysis is based on $150 billion in annualized freight transactions.
Load-to-truck ratios reflect truckload supply and demand on the DAT One marketplace and indicate the pricing environment for truckload freight.
About DAT Freight & Analytics
DAT Freight & Analytics operates the largest truckload freight marketplace in North America. Shippers, transportation brokers, carriers, news organizations and industry analysts rely on DAT for market trends and data insights based on more than 400 million freight matches and a database of $150 billion in annual market transactions.
Founded in 1978, DAT is a business unit of Roper Technologies (Nasdaq: ROP), a constituent of the S&P 500 and Fortune 1000 indices.
View source version on businesswire.com: https://www.businesswire.com/news/home/20230818042461/en/
Contacts
Annabel Reeves
Corporate Communications, DAT Freight & Analytics
PR@dat.com / annabel.reeves@dat.com; 503-501-0143


