
37% Increase in Revenue Sequentially, Gross Profit Increased to 28%, Cash Swells to a Record $60 Million
Soluna Holdings, Inc. (“Soluna” or the “Company”) (NASDAQ: SLNH), a developer of green data centers for intensive computing applications, including Bitcoin mining and AI, announced its financial results for the third quarter ended September 30, 2025.
This press release features multimedia. View the full release here: https://www.businesswire.com/news/home/20251117209594/en/
Soluna Reports Q3-2025 Revenue by Quarter
“This is a new Soluna,” said John Belizaire, CEO of Soluna Holdings. “What we achieved in the third quarter reflects the exceptional execution of our small but mighty team. We’ve proven that our business model works and scales, strengthened our position as a leading Bitcoin hosting provider, and attracted new, world-class capital partners.”
Belizaire continued: “We’ve also strengthened our capital structure to be more flexible and growth-oriented. With this foundation, we now have more firepower to accelerate the growth of our existing business and expand into the fast-growing AI market.”
Q3 2025 Operational and Corporate Highlights:
- $100 Million Credit Facility from Generate Capital – Soluna announced the close of a scalable credit facility up to $100 million from Generate Capital. The initial $12.6 million draw in September funded refinancing and construction of active data center projects, with additional capital support for Soluna’s 1 gigawatt and expanding pipeline.
- $20M Secured to Launch Project Kati 1 and Broke Ground – Spring Lane Capital expands its investment in Soluna to fund the first 35 MW of Project Kati, a wind-powered data center site in Texas. Construction began on September 18, 2025.
- Settlement with NYDIG – As disclosed in our Form 8-K filed September 30, 2025, Soluna reached a settlement with NYDIG, resolving all outstanding matters and clearing the path for future growth and partnership.
- Regained Nasdaq Compliance – Soluna has regained compliance with Nasdaq’s continued listing requirements, strengthening our position on the public markets, preserving access to the capital markets, and liquidity for our shareholders.
- Surpassed 4 EH/s of Hash Rate Under Management – With the commissioning of Dorothy 2 and fleet upgrades deployed across all sites, Soluna surpassed 4 EH/s of hash rate under management.
- Surpassed One Gigawatt of Clean Computing Projects – With the addition of Project Gladys (150 MW under development, wind) and Project Fei (100 MW under development, solar), Soluna’s now exceeds 1 GW of renewable-powered computing in operation, construction, and development. This milestone reflects the scalability of Soluna’s behind-the-meter model and marks a major step toward our 2.8 GW long-term roadmap.
- Expanded Partnership with Galaxy Digital – Galaxy is expected to deploy 48 MW at Project Kati 1, bringing the site’s total to 83 MW. This marks Soluna’s largest hosting deployment to date and deepens our institutional partnerships.
- Dorothy 2 Reaches Full Capacity – A 30 MW expansion with a top-tier Bitcoin miner marked the third deployment with this long-standing customer, bringing Project Dorothy 2 to full hosting capacity. Learn more about this milestone here.
- Strong Capital Formation in Q3 – Soluna strengthened its balance sheet with successful capital raises totaling approximately $64 million gross through a combination of equity raises, warrant exercises, project-level equity, and debt.
Third Quarter Finance and Operations Highlights:
- Record Level Cash Reserves Strengthen Balance Sheet – Cash increased by $45 million to $60.5 million, bolstering our reserves for future investment opportunities.
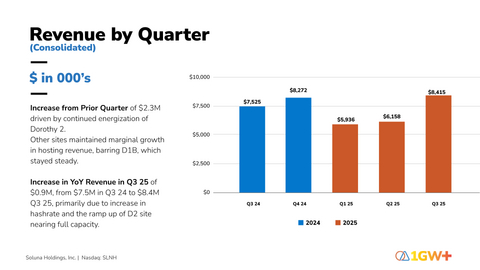
- Revenue for the three months increased by 37% or $2.3 million from Q2 2025 to Q3 2025 – driven by new Dorothy 2 customers. Other sites maintained marginal growth in hosting revenue, except for Dorothy 1B, which remained steady.
-
Q3 2025 Gross profit increased to 28%, compared to 19% in Q2 2025 – reflecting strong cost discipline and margin stability, in addition to $400k in one-time electricity credits.
- Dorothy 1A and Sophie delivered strong gross margins of 43.6% and 68.4%, respectively.
- Dorothy 1B began a site-level miner fleet upgrade to help improve gross profit.
- Dorothy 2 commenced customer deployments in Q2, with labor costs ramping ahead of revenue, consistent with planned early-stage operations. Q3 saw a major increase in revenue (+$2M) from Q2.
- Net loss for the three months increased from Q3 2024 to Q3 2025 by ($17.7 million) – driven by the fair value adjustment of exercised warrants, related to July equity offering, ($22.0 million), and other financing expenses ($4.7 million), offset by the loss on SLC equipment loan and gain on NYDIG debt agreement reported as a net $10.1 million Gain on debt extinguishment and revaluation.
- Adjusted EBITDA decreased from Q3 2024 to Q3 2025 to ($6.4M) – decreased by $2.9 million from Q3 2024, due to compensation related to 2024 of $1.3 million, and approximately $1.0 million increase in professional fees in Q3 2025.
- Adjusted EBITDA increased from Q3 2024 to Q3 2025 – excluding special charges from Cloudco HPE costs, bonus, and Preferred B consent fees and broker fees - by $0.1 million to a positive adjusted EBITDA of $0.1 million, compared to Q3 2024.
- Q3 2025 capital raised over $64 million gross– from a mix of public market and project-level equity and debt sources to fund our growth, development, and operations.
Q3 2025 Revenue & Cost of Revenue by Project Site
| Soluna Digital |
|
|||||||||||||||||
| (Dollars in thousands) | Project Dorothy 1B | Project Dorothy 1A | Project Dorothy 2 | Project Sophie | Other | Soluna Digital Subtotal | ||||||||||||
|
|
|||||||||||||||||
| Cryptocurrency mining revenue | $ | 2,769 |
$ |
- |
$ |
- |
$ |
- |
$ |
- |
$ |
2,769 |
||||||
| Data hosting revenue | - |
|
1,650 |
|
2,203 |
|
1,404 |
|
- |
|
5,257 |
|||||||
| Demand response services | - |
|
- |
|
- |
|
- |
|
389 |
|
389 |
|||||||
| Total revenue | 2,769 |
|
1,650 |
|
2,203 |
|
1,404 |
|
389 |
|
8,415 |
|||||||
|
|
|
|
|
||||||||||||||
| Cost of cryptocurrency mining, exclusive of depreciation | $ | 1,708 |
$ |
- |
$ |
- |
$ |
- |
$ |
- |
$ |
1,708 |
||||||
| Cost of data hosting revenue, exclusive of depreciation | - |
|
669 |
|
1,558 |
|
345 |
|
88 |
|
2,660 |
|||||||
| Cost of cryptocurrency mining revenue-depreciation | 1,053 |
|
- |
|
- |
|
- |
|
- |
|
1,053 |
|||||||
| Cost of data hosting revenue- depreciation | - |
|
261 |
|
306 |
|
98 |
|
- |
|
665 |
|||||||
| Total cost of revenue | $ | 2,761 |
$ |
930 |
$ |
1,864 |
$ |
443 |
$ |
88 |
$ |
6,086 |
||||||
|
|
|
|
|
||||||||||||||
| Gross Profit | $ | 8 |
$ |
720 |
$ |
339 |
$ |
961 |
$ |
301 |
$ |
2,329 |
||||||
| Gross Profit Margin % | 0% |
|
44% |
|
15% |
|
68% |
|
77% |
|
28% |
|||||||
Q3 2024 Revenue & Cost of Revenue by Project Site
| Soluna Digital |
|
Soluna Cloud | Total | |||||||||||||||||||||
| (Dollars in thousands) | Project Dorothy 1B | Project Dorothy 1A | Project Dorothy 2 | Project Sophie | Other | Soluna Digital Subtotal | Project Ada | |||||||||||||||||
|
|
|
||||||||||||||||||||||
| Cryptocurrency mining revenue | $ |
2,811 |
$ |
- |
$ |
- |
$ |
- |
$ |
- |
$ |
2,811 |
$ |
- |
$ |
2,811 |
||||||||
| Data hosting revenue |
|
- |
|
3,515 |
|
- |
|
756 |
|
- |
|
4,271 |
|
- |
|
4,271 |
||||||||
| Demand response services |
|
- |
|
- |
|
- |
|
- |
|
- |
|
- |
|
- |
|
- |
||||||||
| High-performance computing services |
|
- |
|
- |
|
- |
|
- |
|
443 |
|
443 |
|
- |
|
443 |
||||||||
| Total revenue |
|
2,811 |
|
3,515 |
|
- |
|
756 |
|
443 |
|
7,525 |
|
- |
|
7,525 |
||||||||
|
|
|
|
|
|
|
|
|||||||||||||||||
| Cost of cryptocurrency mining, exclusive of depreciation | $ |
1,963 |
$ |
- |
$ |
- |
$ |
- |
$ |
- |
$ |
1,963 |
$ |
- |
$ |
1,963 |
||||||||
| Cost of data hosting revenue, exclusive of depreciation |
|
- |
|
2,025 |
|
- |
|
521 |
|
9 |
|
2,555 |
|
- |
|
2,555 |
||||||||
| Cost of high-performance computing service revenue |
|
- |
|
- |
|
- |
|
- |
|
- |
|
- |
|
2,859 |
|
2,859 |
||||||||
| Cost of cryptocurrency mining revenue-depreciation |
|
1,076 |
|
284 |
|
- |
|
152 |
|
- |
|
1,512 |
|
- |
|
1,512 |
||||||||
| Cost of data hosting revenue- depreciation |
|
|
|
- |
|
|
|
|
|
|||||||||||||||
| Total cost of revenue | $ |
3,039 |
$ |
2,309 |
$ |
- |
$ |
673 |
$ |
9 |
$ |
6,030 |
$ |
2,859 |
$ |
8,889 |
||||||||
|
|
|
|
|
|
|
|
|||||||||||||||||
| Gross Profit | $ |
(228) |
$ |
1,206 |
$ |
- |
$ |
83 |
$ |
434 |
$ |
1,495 |
$ |
(2,859) |
$ |
(1,364) |
||||||||
The audited financial statements and Annual Report on Form 10-K for the year ended December 31, 2024, filed with the U.S. Securities and Exchange Commission (“SEC”) on March 31, 2025, are available online.
Our current Investor Presentation can be found here.
Our 2025 Earnings Power Presentation can be found here.
Soluna’s glossary of terms can be found here.
Safe Harbor Statement
This announcement contains forward-looking statements. These statements are made under the "safe harbor" provisions of the U.S. Private Securities Litigation Reform Act of 1995. These forward-looking statements can be identified by terminology such as "will," "expects," "anticipates," "future," "intends," "plans," "believes," "estimates," "confident," and similar statements. Other examples of forward-looking statements may include, but are not limited to, (i) statements of Company plans and objectives, including the deployments at Project Kati 1, (ii) statements of future economic performance, and (iii) statements of assumptions underlying other statements about the Company or its business. Soluna may also make written or oral forward-looking statements in its periodic reports to the SEC, in its annual report to shareholders, in press releases and other written materials, and in oral statements made by its officers, directors, or employees to third parties. Statements that are not historical facts, including but not limited to statements about Soluna’s beliefs and expectations, are forward-looking statements. Forward-looking statements involve inherent risks and uncertainties, further information regarding which is included in the Company's filings with the SEC. All information provided in this press release is as of the date of the press release, and Soluna undertakes no duty to update such information, except as required under applicable law.
Non-GAAP Measures
In addition to figures prepared in accordance with generally accepted accounting principles (“GAAP”), Soluna from time to time may present alternative non-GAAP performance measures, e.g., EBITDA, adjusted EBITDA, adjusted net profit/loss, adjusted earnings per share, free cash flow, both on a company basis and on a project-level basis, among others. EBITDA is defined as earnings before interest, taxes, and depreciation and amortization. Adjusted EBITDA is defined as EBITDA adjusted for stock-based compensation costs, provision for credit losses, loss on sale of fixed assets and credit on equipment deposit, provision for credit losses, impairment on fixed assets, fair value adjustment loss (gain), fair value on placement agent warrants financing fee, and loss (gain) on debt extinguishment and revaluation, net. Project-level measures may not take into account a full allocation of corporate expenses. These measures should be considered in addition to, but not as a substitute for, the information prepared in accordance with GAAP. Alternative performance measures are not subject to GAAP or any other generally accepted accounting principles. Other companies may define these terms in different ways. See our annual report on Form 10-K for the year ended December 31, 2024, for an explanation of how management uses these measures in evaluating its operations. Investors should review the non-GAAP reconciliations provided above and not rely on any single financial measure to evaluate the Company’s business.
About Soluna Holdings, Inc. (Nasdaq: SLNH)
Soluna is on a mission to make renewable energy a global superpower using computing as a catalyst. The company designs, develops, and operates digital infrastructure that transforms surplus renewable energy into global computing resources. Soluna’s pioneering data centers are strategically co-located with wind, solar, or hydroelectric power plants to support high-performance computing applications, including Bitcoin Mining, Generative AI, and other compute-intensive applications. Soluna’s proprietary software MaestroOS(™) helps energize a greener grid while delivering cost-effective and sustainable computing solutions and superior returns. To learn more, visit solunacomputing.com and follow us on:
LinkedIn: https://www.linkedin.com/company/solunaholdings/
X (formerly Twitter): x.com/solunaholdings
YouTube: youtube.com/c/solunacomputing
Newsletter: bit.ly/solunasubscribe
Resource Center: solunacomputing.com/resources
Soluna regularly posts important information on its website and encourages investors and potential investors to consult the Soluna investor relations and investor resources sections of its website regularly.
Soluna Holdings, Inc. and Subsidiaries |
||||||||
Condensed Consolidated Balance Sheets |
||||||||
As of September 30, 2025 (Unaudited) and December 31, 2024 |
||||||||
(Dollars in thousands, except per share) |
|
September 30, 2025 |
|
December 31, 2024 |
||||
Assets |
|
|
|
|
|
|
|
|
Current Assets: |
|
|
|
|
|
|
|
|
Cash |
|
$ |
51,371 |
|
|
$ |
7,843 |
|
Restricted cash |
|
|
3,630 |
|
|
|
1,150 |
|
Accounts receivable, net (allowance for expected credit losses of $244 at September 30, 2025 and December 31, 2024) |
|
|
4,408 |
|
|
|
2,693 |
|
Prepaid expenses and other current assets |
|
|
3,522 |
|
|
|
1,781 |
|
Loan commitment assets |
|
|
3,474 |
|
|
|
- |
|
Equipment held for sale |
|
|
- |
|
|
|
28 |
|
Total Current Assets |
|
|
66,405 |
|
|
|
13,495 |
|
Restricted cash, noncurrent |
|
|
5,460 |
|
|
|
1,460 |
|
Other assets |
|
|
1,090 |
|
|
|
2,724 |
|
Deposits and credits on equipment |
|
|
813 |
|
|
|
5,145 |
|
Property, plant and equipment, net |
|
|
63,999 |
|
|
|
47,283 |
|
Intangible assets, net |
|
|
10,593 |
|
|
|
17,620 |
|
Operating lease right-of-use assets |
|
|
3,675 |
|
|
|
313 |
|
Total Assets |
|
$ |
152,035 |
|
|
$ |
88,040 |
|
|
|
|
|
|
|
|
|
|
Liabilities and Stockholders’ Equity |
|
|
|
|
|
|
|
|
Current Liabilities: |
|
|
|
|
|
|
|
|
Accounts payable |
|
$ |
4,860 |
|
|
$ |
2,840 |
|
Accrued liabilities |
|
|
12,426 |
|
|
|
6,785 |
|
Accrued interest payable |
|
|
342 |
|
|
|
2,275 |
|
Contract liability |
|
|
19,348 |
|
|
|
20,015 |
|
Current portion of debt |
|
|
9,999 |
|
|
|
14,444 |
|
Income tax payable |
|
|
71 |
|
|
|
37 |
|
Warrant liability |
|
|
7,225 |
|
|
|
- |
|
Customer deposits |
|
|
1,823 |
|
|
|
1,416 |
|
Operating lease liability |
|
|
96 |
|
|
|
61 |
|
Total Current Liabilities |
|
|
56,190 |
|
|
|
47,873 |
|
|
|
|
|
|
|
|
|
|
Other liabilities |
|
|
2,001 |
|
|
|
235 |
|
Long-term debt |
|
|
13,254 |
|
|
|
7,061 |
|
Operating lease liability |
|
|
3,583 |
|
|
|
252 |
|
Deferred tax liability, net |
|
|
3,542 |
|
|
|
5,257 |
|
Total Liabilities |
|
|
78,570 |
|
|
|
60,678 |
|
|
|
|
|
|
|
|
|
|
Commitments and Contingencies (Note 10) |
|
|
|
|
|
|
|
|
|
|
|
|
|
|
|
|
|
Stockholders’ Equity: |
|
|
|
|
|
|
|
|
9.0% Series A Cumulative Perpetual Preferred Stock, par value $0.001 per share, $25.00 liquidation preference; authorized 6,040,000; 4,928,545 shares issued and outstanding as of September 30, 2025 and 4,953,545 December 31, 2024 |
|
|
5 |
|
|
|
5 |
|
Series B Preferred Stock, par value $0.0001 per share, authorized 187,500; 62,500 shares issued and outstanding as of September 30, 2025 and December 31, 2024 |
|
|
— |
|
|
|
— |
|
Common stock, par value $0.001 per share, authorized 75,000,000; 64,092,531 shares issued and 64,051,790 shares outstanding as of September 30, 2025 and 10,647,761 shares issued and 10,607,020 shares outstanding as of December 31, 2024 |
|
|
64 |
|
|
|
11 |
|
Additional paid-in capital |
|
|
381,399 |
|
|
|
315,607 |
|
Accumulated deficit |
|
|
(353,198 |
) |
|
|
(314,304 |
) |
Common stock in treasury, at cost, 40,741 shares at September 30, 2025 and December 31, 2024 |
|
|
(13,798 |
) |
|
|
(13,798 |
) |
Total Soluna Holdings, Inc. Stockholders’ Equity (Deficit) |
|
|
14,472 |
|
|
|
(12,479 |
) |
Non-Controlling Interest |
|
|
58,993 |
|
|
|
39,841 |
|
Total Stockholders’ Equity |
|
|
73,465 |
|
|
|
27,362 |
|
Total Liabilities and Stockholders’ Equity |
|
$ |
152,035 |
|
|
$ |
88,040 |
|
Soluna Holdings, Inc. and Subsidiaries |
||||||||||||||||
Condensed Consolidated Statements of Operations (Unaudited) |
||||||||||||||||
For the Three and Nine Months Ended September 30, 2025 and 2024 |
||||||||||||||||
(Dollars in thousands, except per share) |
|
Three Months Ended |
|
Nine Months Ended |
||||||||||||
|
|
September 30, |
|
September 30, |
|
|||||||||||
|
|
2025 |
|
2024 |
|
2025 |
|
2024 |
||||||||
|
|
|
|
|
|
|
|
|
|
|
|
|
||||
Cryptocurrency mining revenue |
|
$ |
2,769 |
|
|
$ |
2,811 |
|
|
$ |
8,630 |
|
|
$ |
13,691 |
|
Data hosting revenue |
|
|
5,257 |
|
|
|
4,271 |
|
|
|
10,795 |
|
|
|
14,446 |
|
Demand response service revenue |
|
|
389 |
|
|
|
443 |
|
|
|
1,057 |
|
|
|
1,612 |
|
High-performance computing service revenue |
|
|
- |
|
|
|
- |
|
|
|
28 |
|
|
|
- |
|
Total revenue |
|
|
8,415 |
|
|
|
7,525 |
|
|
|
20,510 |
|
|
|
29,749 |
|
Operating costs: |
|
|
|
|
|
|
|
|
|
|
|
|
|
|
|
|
Cost of cryptocurrency mining revenue, exclusive of depreciation |
|
|
1,708 |
|
|
|
1,963 |
|
|
|
5,428 |
|
|
|
5,687 |
|
Cost of data hosting revenue, exclusive of depreciation |
|
|
2,660 |
|
|
|
2,555 |
|
|
|
5,605 |
|
|
|
6,982 |
|
Cost of high-performance computing services |
|
|
- |
|
|
|
2,859 |
|
|
|
7 |
|
|
|
2,859 |
|
Cost of cryptocurrency mining revenue- depreciation |
|
|
1,053 |
|
|
|
1,068 |
|
|
|
3,200 |
|
|
|
3,220 |
|
Cost of data hosting revenue- depreciation |
|
|
665 |
|
|
|
444 |
|
|
|
1,578 |
|
|
|
1,320 |
|
Total costs of revenue |
|
|
6,086 |
|
|
|
8,889 |
|
|
|
15,818 |
|
|
|
20,068 |
|
Operating expenses: |
|
|
|
|
|
|
|
|
|
|
|
|
|
|
|
|
General and administrative expenses, exclusive of depreciation and amortization |
|
|
7,708 |
|
|
|
5,248 |
|
|
|
19,053 |
|
|
|
14,625 |
|
Depreciation and amortization associated with general and administrative expenses |
|
|
2,401 |
|
|
|
2,404 |
|
|
|
7,207 |
|
|
|
7,209 |
|
Total general and administrative expenses |
|
|
10,109 |
|
|
|
7,652 |
|
|
|
26,260 |
|
|
|
21,834 |
|
Impairment on fixed assets |
|
|
- |
|
|
|
- |
|
|
|
12 |
|
|
|
130 |
|
Operating loss |
|
|
(7,780 |
) |
|
|
(9,016 |
) |
|
|
(21,580 |
) |
|
|
(12,283 |
) |
Interest expense |
|
|
(1,212 |
) |
|
|
(821 |
) |
|
|
(3,246 |
) |
|
|
(1,694 |
) |
Gain (loss) on debt extinguishment and revaluation, net |
|
|
10,107 |
|
|
|
875 |
|
|
|
10,658 |
|
|
|
(1,888 |
) |
Loss on sale of fixed assets and credit on equipment deposit |
|
|
(780 |
) |
|
|
- |
|
|
|
(802 |
) |
|
|
(21 |
) |
Fair value adjustment (loss) gain |
|
|
(22,047 |
) |
|
|
328 |
|
|
|
(22,165 |
) |
|
|
(5,607 |
) |
Other financing expense |
|
|
(4,746 |
) |
|
|
- |
|
|
|
(5,203 |
) |
|
|
- |
|
Other income (expense), net |
|
|
5 |
|
|
|
(6 |
) |
|
|
(280 |
) |
|
|
(32 |
) |
Loss before income taxes |
|
|
(26,453 |
) |
|
|
(8,640 |
) |
|
|
(42,618 |
) |
|
|
(21,525 |
) |
Income tax benefit, net |
|
|
666 |
|
|
|
547 |
|
|
|
1,697 |
|
|
|
1,743 |
|
Net loss |
|
|
(25,787 |
) |
|
|
(8,093 |
) |
|
|
(40,921 |
) |
|
|
(19,782 |
) |
(Less) Net loss (income) attributable to non-controlling interest |
|
|
1,831 |
|
|
|
903 |
|
|
|
2,027 |
|
|
|
(3,535 |
) |
Net loss attributable to Soluna Holdings, Inc. |
|
$ |
(23,956 |
) |
|
$ |
(7,190 |
) |
|
$ |
(38,894 |
) |
|
$ |
(23,317 |
) |
|
|
|
|
|
|
|
|
|
|
|
|
|
|
|
|
|
Basic and Diluted loss per common share: |
|
|
|
|
|
|
|
|
|
|
|
|
|
|
|
|
Basic & Diluted loss per share |
|
$ |
(1.14 |
) |
|
$ |
(1.56 |
) |
|
$ |
(3.29 |
) |
|
$ |
(7.15 |
) |
|
|
|
|
|
|
|
|
|
|
|
|
|
|
|
|
|
Weighted average shares outstanding (Basic and Diluted) |
|
|
26,983,023 |
|
|
|
6,388,335 |
|
|
|
15,683,072 |
|
|
|
4,320,546 |
|
The accompanying notes are an integral part of these unaudited condensed consolidated financial statements. |
||||||||||||||||
Soluna Holdings, Inc. and Subsidiaries |
||||||||
Condensed Consolidated Statements of Cash Flows (Unaudited) |
||||||||
For the Nine Months Ended September 30, 2025 and 2024 |
||||||||
|
|
Nine Months Ended September 30, |
||||||
(Dollars in thousands) |
|
2025 |
|
2024 |
||||
Operating Activities |
|
|
|
|
|
|
|
|
Net loss |
|
$ |
(40,921 |
) |
|
$ |
(19,782 |
) |
|
|
|
|
|
|
|
|
|
Adjustments to reconcile net loss to net cash used in operating activities: |
|
|
|
|
|
|
|
|
Depreciation expense |
|
|
4,866 |
|
|
|
4,634 |
|
Amortization expense |
|
|
7,119 |
|
|
|
7,116 |
|
Stock-based compensation |
|
|
5,671 |
|
|
|
3,286 |
|
Deferred income taxes |
|
|
(1,716 |
) |
|
|
(1,806 |
) |
Impairment on fixed assets |
|
|
12 |
|
|
|
130 |
|
Provision for credit losses |
|
|
- |
|
|
|
611 |
|
Amortization of operating lease asset |
|
|
79 |
|
|
|
139 |
|
(Gain) loss on debt extinguishment and revaluation, net |
|
|
(10,658 |
) |
|
|
1,888 |
|
Amortization of deferred financing costs and discount on notes |
|
|
561 |
|
|
|
179 |
|
Fair value adjustments, including SEPA |
|
|
22,165 |
|
|
|
5,607 |
|
Fair value on placement warrant financing cost |
|
|
146 |
|
|
|
- |
|
Loss on sale of fixed assets and credit on equipment deposit |
|
|
802 |
|
|
|
21 |
|
Changes in operating assets and liabilities: |
|
|
|
|
|
|
|
|
Accounts receivable |
|
|
(1,715 |
) |
|
|
536 |
|
Prepaid expenses and other current assets |
|
|
(1,741 |
) |
|
|
(3,429 |
) |
Other long-term assets |
|
|
1,608 |
|
|
|
(5,771 |
) |
Accounts payable |
|
|
2,020 |
|
|
|
1,159 |
|
Contract liability |
|
|
(667 |
) |
|
|
- |
|
Operating lease liabilities |
|
|
(75 |
) |
|
|
(141 |
) |
Other liabilities and customer deposits |
|
|
2,173 |
|
|
|
(811 |
) |
Accrued liabilities and interest payable |
|
|
6,792 |
|
|
|
3,022 |
|
Net cash used in operating activities |
|
|
(3,479 |
) |
|
|
(3,412 |
) |
Investing Activities |
|
|
|
|
|
|
|
|
Purchases of property, plant, and equipment |
|
|
(17,008 |
) |
|
|
(3,712 |
) |
Purchases of intangible assets |
|
|
(92 |
) |
|
|
(95 |
) |
Proceeds from sale of property, plant, and equipment |
|
|
- |
|
|
|
215 |
|
Deposits on equipment |
|
|
(1,028 |
) |
|
|
(4,099 |
) |
Net cash used in investing activities |
|
|
(18,128 |
) |
|
|
(7,691 |
) |
Financing Activities |
|
|
|
|
|
|
|
|
Proceeds from common stock warrant exercises |
|
|
9,455 |
|
|
|
2,330 |
|
Proceeds from sale of common stock on SEPA |
|
|
6,176 |
|
|
|
- |
|
Proceeds from notes |
|
|
18,434 |
|
|
|
14,470 |
|
Proceeds from sale of common stock on ATM |
|
|
22,961 |
|
|
|
- |
|
Proceeds from July equity issuance |
|
|
4,509 |
|
|
|
- |
|
Costs associated with July equity issuance |
|
|
(145 |
) |
|
|
- |
|
Payments on notes and deferred financing costs |
|
|
(6,938 |
) |
|
|
(2,261 |
) |
Payments on ATM |
|
|
(162 |
) |
|
|
- |
|
Contributions from non-controlling interest |
|
|
22,078 |
|
|
|
5,098 |
|
Distributions to non-controlling interest |
|
|
(4,753 |
) |
|
|
(6,694 |
) |
Net cash provided by financing activities |
|
|
71,615 |
|
|
|
12,943 |
|
|
|
|
|
|
|
|
|
|
Increase in cash & restricted cash |
|
|
50,008 |
|
|
|
1,840 |
|
Cash & restricted cash – beginning of period |
|
|
10,453 |
|
|
|
10,367 |
|
Cash & restricted cash – end of period |
|
$ |
60,461 |
|
|
$ |
12,207 |
|
|
|
|
|
|
|
|
|
|
Supplemental Disclosure of Cash Flow Information |
|
|
|
|
|
|
|
|
Interest paid on debt |
|
|
1,081 |
|
|
|
218 |
|
Fair value consideration for Green Cloud issuance of shares |
|
|
810 |
|
|
|
- |
|
Noncash financing cost accrual |
|
|
647 |
|
|
|
- |
|
Noncash deferred financing cost accrual |
|
|
1,078 |
|
|
|
- |
|
Warrant consideration in relation to Generate Common Warrant |
|
|
2,635 |
|
|
|
- |
|
Warrant consideration in relation to convertible notes and revaluation of warrant liability |
|
|
- |
|
|
|
5,606 |
|
Notes converted to common stock |
|
|
- |
|
|
|
5,877 |
|
Noncash membership distribution accrual |
|
|
- |
|
|
|
741 |
|
Warrant consideration in relation to Soluna Cloud |
|
|
- |
|
|
|
1,440 |
|
Noncash non-controlling interest contributions |
|
|
2,675 |
|
|
|
250 |
|
Noncash activity right-of-use assets obtained in exchange for lease obligations |
|
|
3,441 |
|
|
|
- |
|
The accompanying notes are an integral part of these unaudited condensed consolidated financial statements. |
||||||||
Segment Information
The following table details revenue, cost of revenues, and other operating costs for the Company’s reportable segments for three months ended September 30, 2025 and 2024, and reconciles to net income (loss) on the consolidated statements of operations:
For the three months ended September 30, 2025 |
||||||||||||||||
|
|
Cryptocurrency Mining |
|
Data Center Hosting |
|
High- Performance Computing Services |
|
Total |
||||||||
Segment Revenue: Revenue from external customers |
|
$ |
2,769 |
|
|
$ |
5,257 |
|
|
$ |
- |
|
|
$ |
8,026 |
|
Reconciliation of revenue |
|
|
|
|
|
|
|
|
|
|
|
|
|
|
|
|
Demand response service revenue (a) |
|
|
|
|
|
|
|
|
|
|
|
|
|
|
389 |
|
Total consolidated revenue |
|
|
|
|
|
|
|
|
|
|
|
|
|
|
8,415 |
|
Less: Segment cost of revenue |
|
|
|
|
|
|
|
|
|
|
|
|
|
|
|
|
Utility costs |
|
|
1,237 |
|
|
|
1,308 |
|
|
|
- |
|
|
|
2,545 |
|
Wages, benefits, and employee related costs |
|
|
167 |
|
|
|
665 |
|
|
|
- |
|
|
|
832 |
|
Facilities and Equipment costs |
|
|
243 |
|
|
|
556 |
|
|
|
- |
|
|
|
799 |
|
Cost of revenue- depreciation |
|
|
1,053 |
|
|
|
665 |
|
|
|
- |
|
|
|
1,718 |
|
Other cost of revenue* |
|
|
123 |
|
|
|
330 |
|
|
|
- |
|
|
|
453 |
|
Total segment cost of revenue |
|
|
2,823 |
|
|
|
3,524 |
|
|
|
- |
|
|
|
6,347 |
|
General and administrative expenses |
|
|
3 |
|
|
|
874 |
|
|
|
- |
|
|
|
877 |
|
Impairment on fixed assets |
|
|
- |
|
|
|
- |
|
|
|
- |
|
|
|
- |
|
Segment operating income (loss) |
|
$ |
(57 |
) |
|
$ |
859 |
|
|
$ |
- |
|
|
$ |
802 |
|
For the three months ended September 30, 2024 |
||||||||||||||||
|
|
Cryptocurrency Mining |
|
Data Center Hosting |
|
High- Performance Computing Services |
|
Total |
||||||||
Segment Revenue: Revenue from external customers |
|
$ |
2,811 |
|
|
|
4,271 |
|
|
$ |
- |
|
|
$ |
7,082 |
|
Reconciliation of revenue |
|
|
|
|
|
|
|
|
|
|
|
|
|
|
|
|
Demand response service revenue (a) |
|
|
- |
|
|
|
- |
|
|
|
- |
|
|
|
443 |
|
|
|
|
|
|
|
|
|
|
|
|
|
|
|
|
7,525 |
|
Less: Segment cost of revenue |
|
|
|
|
|
|
|
|
|
|
|
|
|
|
|
|
Utility costs |
|
|
1,395 |
|
|
|
1,523 |
|
|
|
- |
|
|
|
2,918 |
|
Wages, benefits, and employee related costs |
|
|
212 |
|
|
|
516 |
|
|
|
- |
|
|
|
728 |
|
Facilities and Equipment costs |
|
|
268 |
|
|
|
389 |
|
|
|
2,859 |
|
|
|
3,516 |
|
Cost of revenue- depreciation |
|
|
1,068 |
|
|
|
444 |
|
|
|
- |
|
|
|
1,512 |
|
Other cost of revenue* |
|
|
183 |
|
|
|
221 |
|
|
|
- |
|
|
|
404 |
|
Total segment cost of revenue |
|
|
3,126 |
|
|
|
3,093 |
|
|
|
2,859 |
|
|
|
9,078 |
|
General and administrative expenses |
|
|
57 |
|
|
|
804 |
|
|
|
83 |
|
|
|
944 |
|
Impairment on fixed assets |
|
|
- |
|
|
|
- |
|
|
|
- |
|
|
|
- |
|
Segment operating income (loss) |
|
$ |
(372 |
) |
|
$ |
374 |
|
|
$ |
(2,942 |
) |
|
$ |
(2,940 |
) |
(a) |
|
Demand response service revenue is included as a reconciling item of total revenue and not included as part of segment gross profit or loss. |
|
|
|
* |
|
Other cost of revenue includes insurance, outside service costs and margins, and general costs. |
The following table presents the reconciliation of segment operating income (loss) to net income (loss) before taxes:
|
|
For the three months ended September 30, |
||||||
|
|
2025 |
|
2024 |
||||
Segment operating income (loss) |
|
$ |
802 |
|
|
$ |
(2,940 |
) |
|
|
|
|
|
|
|
|
|
Reconciling Items: |
|
|
|
|
|
|
|
|
Elimination of intercompany costs |
|
|
261 |
|
|
|
189 |
|
Other revenue (a) |
|
|
389 |
|
|
|
443 |
|
General and administrative, exclusive of depreciation and amortization (b) |
|
|
(6,831 |
) |
|
|
(4,304 |
) |
General and administrative, depreciation and amortization |
|
|
(2,401 |
) |
|
|
(2,404 |
) |
Interest expense |
|
|
(1,212 |
) |
|
|
(821 |
) |
(Loss) gain on debt extinguishment and revaluation, net |
|
|
10,107 |
|
|
|
875 |
|
Other financing expense |
|
|
(4,746 |
) |
|
|
- |
|
Loss on sale of fixed assets and credit on equipment deposit |
|
|
(780 |
) |
|
|
- |
|
Fair value adjustment (loss) gain |
|
|
(22,047 |
) |
|
|
328 |
|
Other income (expense), net |
|
|
5 |
|
|
|
(6 |
) |
Net loss before taxes |
|
$ |
(26,453 |
) |
|
$ |
(8,640 |
) |
(a) |
|
Demand response service revenue is included as a reconciling item of total revenue and not included as part of segment gross profit or loss. |
|
|
|
(b) |
|
The reconciling general and administrative expense, exclusive of depreciation and amortization represent corporate and unallocated general and administrative expenses for the three months ended September 30, 2025 and 2024. |
The following table details revenue, cost of revenues, and other operating costs for the Company’s reportable segments for nine months ended September 30, 2025 and 2024, and reconciles to net income (loss) on the consolidated statements of operations:
For the nine months ended September 30, 2025 |
||||||||||||||||
|
|
Cryptocurrency Mining |
|
Data Center Hosting |
|
High- Performance Computing Services |
|
Total |
||||||||
Segment Revenue: Revenue from external customers |
|
$ |
8,630 |
|
|
$ |
10,795 |
|
|
$ |
28 |
|
|
$ |
19,453 |
|
Reconciliation of revenue |
|
|
|
|
|
|
|
|
|
|
|
|
|
|
|
|
Demand response service revenue (a) |
|
|
|
|
|
|
|
|
|
|
|
|
|
|
1,057 |
|
Total consolidated revenue |
|
|
|
|
|
|
|
|
|
|
|
|
|
|
20,510 |
|
Less: Segment cost of revenue |
|
|
|
|
|
|
|
|
|
|
|
|
|
|
|
|
Utility costs |
|
|
3,927 |
|
|
|
2,160 |
|
|
|
- |
|
|
|
6,087 |
|
Wages, benefits, and employee related costs |
|
|
588 |
|
|
|
1,668 |
|
|
|
7 |
|
|
|
2,263 |
|
Facilities and Equipment costs |
|
|
701 |
|
|
|
1,448 |
|
|
|
- |
|
|
|
2,149 |
|
Cost of revenue- depreciation |
|
|
3,200 |
|
|
|
1,578 |
|
|
|
- |
|
|
|
4,778 |
|
Other cost of revenue* |
|
|
410 |
|
|
|
839 |
|
|
|
- |
|
|
|
1,249 |
|
Total segment cost of revenue |
|
|
8,826 |
|
|
|
7,693 |
|
|
|
7 |
|
|
|
16,526 |
|
General and administrative expenses |
|
|
62 |
|
|
|
1,337 |
|
|
|
270 |
|
|
|
1,669 |
|
Impairment on fixed assets |
|
|
- |
|
|
|
12 |
|
|
|
- |
|
|
|
12 |
|
Segment operating income (loss) |
|
$ |
(258 |
) |
|
$ |
1,753 |
|
|
$ |
(249 |
) |
|
$ |
1,246 |
|
For the nine months ended September 30, 2024 |
||||||||||||||||
|
|
Cryptocurrency Mining |
|
Data Center Hosting |
|
High- Performance Computing Services |
|
Total |
||||||||
Segment Revenue: Revenue from external customers |
|
$ |
13,691 |
|
|
$ |
14,446 |
|
|
$ |
- |
|
|
$ |
28,137 |
|
Reconciliation of revenue |
|
|
|
|
|
|
|
|
|
|
|
|
|
|
|
|
Demand response service revenue (a) |
|
|
- |
|
|
|
- |
|
|
|
- |
|
|
|
1,612 |
|
|
|
|
|
|
|
|
|
|
|
|
|
|
|
|
29,749 |
|
Less: Segment cost of revenue |
|
|
|
|
|
|
|
|
|
|
|
|
|
|
|
|
Utility costs |
|
|
4,093 |
|
|
|
4,243 |
|
|
|
- |
|
|
|
8,336 |
|
Wages, benefits, and employee related costs |
|
|
594 |
|
|
|
1,443 |
|
|
|
- |
|
|
|
2,037 |
|
Facilities and Equipment costs |
|
|
780 |
|
|
|
1,011 |
|
|
|
2,859 |
|
|
|
4,650 |
|
Cost of revenue- depreciation |
|
|
3,220 |
|
|
|
1,320 |
|
|
|
- |
|
|
|
4,540 |
|
Other cost of revenue* |
|
|
488 |
|
|
|
530 |
|
|
|
- |
|
|
|
1,018 |
|
Total segment cost of revenue |
|
|
9,175 |
|
|
|
8,547 |
|
|
|
2,859 |
|
|
|
20,581 |
|
General and administrative expenses |
|
|
193 |
|
|
|
994 |
|
|
|
141 |
|
|
|
1,328 |
|
Impairment on fixed assets |
|
|
130 |
|
|
|
- |
|
|
|
- |
|
|
|
130 |
|
Segment operating income (loss) |
|
$ |
4,193 |
|
|
$ |
4,905 |
|
|
$ |
(3,000 |
) |
|
$ |
6,098 |
|
(a) |
|
Demand response service revenue is included as a reconciling item of total revenue and not included as part of segment gross profit or loss. |
|
|
|
* |
|
Other cost of revenue includes insurance, outside service costs and margins, and general costs. |
The following table presents the reconciliation of segment operating income (loss) to net income (loss) before taxes:
|
|
For the nine months ended September 30, |
||||||
|
|
2025 |
|
2024 |
||||
Segment operating income |
|
$ |
1,246 |
|
|
$ |
6,098 |
|
|
|
|
|
|
|
|
|
|
Reconciling Items: |
|
|
|
|
|
|
|
|
Elimination of intercompany costs |
|
|
708 |
|
|
|
513 |
|
Other revenue (a) |
|
|
1,057 |
|
|
|
1,612 |
|
General and administrative, exclusive of depreciation and amortization (b) |
|
|
(17,384 |
) |
|
|
(13,297 |
) |
General and administrative, depreciation and amortization |
|
|
(7,207 |
) |
|
|
(7,209 |
) |
Interest expense |
|
|
(3,246 |
) |
|
|
(1,694 |
) |
Gain (loss) on debt extinguishment and revaluation, net |
|
|
10,658 |
|
|
|
(1,888 |
) |
Loss on sale of fixed assets and credit on equipment deposit |
|
|
(802 |
) |
|
|
(21 |
) |
Fair value adjustment loss |
|
|
(22,165 |
) |
|
|
(5,607 |
) |
Other financing expense |
|
|
(5,203 |
) |
|
|
- |
|
Other expense, net |
|
|
(280 |
) |
|
|
(32 |
) |
Net loss before taxes |
|
$ |
(42,618 |
) |
|
$ |
(21,525 |
) |
(a) |
|
Demand response service revenue is included as a reconciling item of total revenue and not included as part of segment gross profit or loss. |
|
|
|
(b) |
|
The reconciling general and administrative expense, exclusive of depreciation and amortization represent corporate and unallocated general and administrative expenses for the nine months ended September 30, 2025 and 2024. |
Gross Profit Breakout:
The following table summarizes the balances for the project sites for cryptocurrency mining revenue, data hosting revenue, high-performance computing service revenue, demand response revenue, cost of cryptocurrency mining revenue, exclusive of depreciation, cost of data hosting revenue, exclusive of depreciation, cost of high-performance computing services, and cost of depreciation during the three months ended September 30, 2025:
|
|
Soluna Digital |
||||||||||||||||||||||
(Dollars in thousands) |
|
Project Dorothy 1B |
|
Project Dorothy 1A |
|
Project Dorothy 2 |
|
Project Sophie |
|
Other |
|
Total |
||||||||||||
|
|
|
|
|
|
|
|
|
|
|
|
|
|
|
|
|
|
|
||||||
Cryptocurrency mining revenue |
|
$ |
2,769 |
|
|
$ |
- |
|
|
$ |
- |
|
|
$ |
- |
|
|
$ |
- |
|
|
$ |
2,769 |
|
Data hosting revenue |
|
|
- |
|
|
|
1,650 |
|
|
|
2,203 |
|
|
|
1,404 |
|
|
|
- |
|
|
|
5,257 |
|
Demand response services |
|
|
- |
|
|
|
- |
|
|
|
- |
|
|
|
- |
|
|
|
389 |
|
|
|
389 |
|
Total revenue |
|
|
2,769 |
|
|
|
1,650 |
|
|
|
2,203 |
|
|
|
1,404 |
|
|
|
389 |
|
|
|
8,415 |
|
|
|
|
|
|
|
|
|
|
|
|
|
|
|
|
|
|
|
|
|
|
|
|
|
|
Cost of cryptocurrency mining, exclusive of depreciation |
|
|
1,708 |
|
|
|
- |
|
|
|
- |
|
|
|
- |
|
|
|
- |
|
|
|
1,708 |
|
Cost of data hosting revenue, exclusive of depreciation |
|
|
- |
|
|
|
669 |
|
|
|
1,558 |
|
|
|
345 |
|
|
|
88 |
|
|
|
2,660 |
|
Cost of cryptocurrency mining revenue- depreciation |
|
|
1,053 |
|
|
|
- |
|
|
|
- |
|
|
|
- |
|
|
|
- |
|
|
|
1,053 |
|
Cost of data hosting revenue- depreciation |
|
|
- |
|
|
|
261 |
|
|
|
306 |
|
|
|
98 |
|
|
|
- |
|
|
|
665 |
|
Total cost of revenue |
|
|
2,761 |
|
|
|
930 |
|
|
|
1,864 |
|
|
|
443 |
|
|
|
88 |
|
|
|
6,086 |
|
Gross profit |
|
$ |
8 |
|
|
$ |
720 |
|
|
$ |
339 |
|
|
$ |
961 |
|
|
$ |
301 |
|
|
$ |
2,329 |
|
The following table summarizes the balances for the project sites for cryptocurrency mining revenue, data hosting revenue, high-performance computing service revenue, demand response revenue, cost of cryptocurrency mining revenue, exclusive of depreciation, cost of data hosting revenue, exclusive of depreciation, cost of high-performance computing services, and cost of depreciation during the three months ended September 30, 2024:
|
|
Soluna Digital |
|
Soluna Cloud |
|
|
|
|||||||||||||||||||||
(Dollars in thousands) |
|
Project Dorothy 1B |
|
Project Dorothy 1A |
|
Project Sophie |
|
Other |
|
Soluna Digital Subtotal |
|
Project Ada |
|
Total |
||||||||||||||
|
|
|
|
|
|
|
|
|
|
|
|
|
|
|
|
|
|
|
|
|
|
|||||||
Cryptocurrency mining revenue |
|
$ |
2,811 |
|
|
$ |
- |
|
|
$ |
- |
|
|
$ |
- |
|
|
$ |
2,811 |
|
|
$ |
- |
|
|
$ |
2,811 |
|
Data hosting revenue |
|
|
- |
|
|
|
3,515 |
|
|
|
756 |
|
|
|
- |
|
|
|
4,271 |
|
|
|
- |
|
|
|
4,271 |
|
Demand response services |
|
|
- |
|
|
|
- |
|
|
|
- |
|
|
|
443 |
|
|
|
443 |
|
|
|
- |
|
|
|
443 |
|
High-performance computing services |
|
|
- |
|
|
|
- |
|
|
|
- |
|
|
|
- |
|
|
|
- |
|
|
|
- |
|
|
|
- |
|
Total revenue |
|
|
2,811 |
|
|
|
3,515 |
|
|
|
756 |
|
|
|
443 |
|
|
|
7,525 |
|
|
|
- |
|
|
|
7,525 |
|
|
|
|
|
|
|
|
|
|
|
|
|
|
|
|
|
|
|
|
|
|
|
|
|
|
|
|
|
|
Cost of cryptocurrency mining, exclusive of depreciation |
|
|
1,963 |
|
|
|
- |
|
|
|
- |
|
|
|
- |
|
|
|
1,963 |
|
|
|
- |
|
|
|
1,963 |
|
Cost of data hosting revenue, exclusive of depreciation |
|
|
- |
|
|
|
2,025 |
|
|
|
521 |
|
|
|
9 |
|
|
|
2,555 |
|
|
|
- |
|
|
|
2,555 |
|
Cost of high-performance computing service revenue |
|
|
- |
|
|
|
- |
|
|
|
- |
|
|
|
- |
|
|
|
- |
|
|
|
2,859 |
|
|
|
2,859 |
|
Cost of cryptocurrency mining revenue- depreciation |
|
|
1,068 |
|
|
|
- |
|
|
|
- |
|
|
|
- |
|
|
|
1,068 |
|
|
|
- |
|
|
|
1,068 |
|
Cost of data hosting revenue- depreciation |
|
|
- |
|
|
|
292 |
|
|
|
152 |
|
|
|
- |
|
|
|
444 |
|
|
|
- |
|
|
|
444 |
|
Total cost of revenue |
|
|
3,031 |
|
|
|
2,317 |
|
|
|
673 |
|
|
|
9 |
|
|
|
6,030 |
|
|
|
2,859 |
|
|
|
8,889 |
|
Gross (loss) profit |
|
$ |
(220 |
) |
|
$ |
1,198 |
|
|
$ |
83 |
|
|
$ |
434 |
|
|
$ |
1,495 |
|
|
$ |
(2,859 |
) |
|
$ |
(1,364 |
) |
The following table summarizes the balances for the project sites for cryptocurrency mining revenue, data hosting revenue, high-performance computing service revenue, demand response revenue, cost of cryptocurrency mining revenue, exclusive of depreciation, cost of data hosting revenue, exclusive of depreciation, cost of high-performance computing services, and cost of depreciation during the nine months ended September 30, 2025:
|
|
Soluna Digital |
|
Soluna Cloud |
|
|
|
|||||||||||||||||||||||||
(Dollars in thousands) |
|
Project Dorothy 1B |
|
Project Dorothy 1A |
|
Project Dorothy 2 |
|
Project Sophie |
|
Other |
|
Soluna Digital Subtotal |
|
Project Ada |
|
Total |
||||||||||||||||
|
|
|
|
|
|
|
|
|
|
|
|
|
|
|
|
|
|
|
|
|
|
|
|
|
||||||||
Cryptocurrency mining revenue |
|
$ |
8,630 |
|
|
$ |
- |
|
|
$ |
- |
|
|
$ |
- |
|
|
$ |
- |
|
|
$ |
8,630 |
|
|
$ |
- |
|
|
$ |
8,630 |
|
Data hosting revenue |
|
|
- |
|
|
|
4,674 |
|
|
|
2,412 |
|
|
|
3,709 |
|
|
|
- |
|
|
|
10,795 |
|
|
|
- |
|
|
|
10,795 |
|
Demand response services |
|
|
- |
|
|
|
- |
|
|
|
- |
|
|
|
- |
|
|
|
1,057 |
|
|
|
1,057 |
|
|
|
- |
|
|
|
1,057 |
|
High-performance computing services |
|
|
- |
|
|
|
- |
|
|
|
- |
|
|
|
- |
|
|
|
- |
|
|
|
- |
|
|
|
28 |
|
|
|
28 |
|
Total revenue |
|
|
8,630 |
|
|
|
4,674 |
|
|
|
2,412 |
|
|
|
3,709 |
|
|
|
1,057 |
|
|
|
20,482 |
|
|
|
28 |
|
|
|
20,510 |
|
|
|
|
|
|
|
|
|
|
|
|
|
|
|
|
|
|
|
|
|
|
|
|
|
|
|
|
|
|
|
|
|
|
Cost of cryptocurrency mining, exclusive of depreciation |
|
|
5,428 |
|
|
|
- |
|
|
|
- |
|
|
|
- |
|
|
|
- |
|
|
|
5,428 |
|
|
|
- |
|
|
|
5,428 |
|
Cost of data hosting revenue, exclusive of depreciation |
|
|
- |
|
|
|
2,405 |
|
|
|
1,974 |
|
|
|
1,138 |
|
|
|
88 |
|
|
|
5,605 |
|
|
|
- |
|
|
|
5,605 |
|
Cost of high-performance computing service revenue |
|
|
- |
|
|
|
- |
|
|
|
- |
|
|
|
- |
|
|
|
- |
|
|
|
- |
|
|
|
7 |
|
|
|
7 |
|
Cost of cryptocurrency mining revenue- depreciation |
|
|
3,200 |
|
|
|
- |
|
|
|
- |
|
|
|
- |
|
|
|
- |
|
|
|
3,200 |
|
|
|
- |
|
|
|
3,200 |
|
Cost of data hosting revenue- depreciation |
|
|
- |
|
|
|
830 |
|
|
|
442 |
|
|
|
306 |
|
|
|
- |
|
|
|
1,578 |
|
|
|
- |
|
|
|
1,578 |
|
Total cost of revenue |
|
|
8,628 |
|
|
|
3,235 |
|
|
|
2,416 |
|
|
|
1,444 |
|
|
|
88 |
|
|
|
15,811 |
|
|
|
7 |
|
|
|
15,818 |
|
Gross (loss) profit |
|
$ |
2 |
|
|
$ |
1,439 |
|
|
$ |
(4 |
) |
|
$ |
2,265 |
|
|
$ |
969 |
|
|
$ |
4,671 |
|
|
$ |
21 |
|
|
$ |
4,692 |
|
The following table summarizes the balances for the project sites for cryptocurrency mining revenue, data hosting revenue, high-performance computing service revenue, demand response revenue, cost of cryptocurrency mining revenue, exclusive of depreciation, cost of data hosting revenue, exclusive of depreciation, cost of high-performance computing services, and cost of depreciation during the nine months ended September 30, 2024:
|
|
Soluna Digital |
|
Soluna Cloud |
|
|
|
|||||||||||||||||||||
(Dollars in thousands) |
|
Project Dorothy 1B |
|
Project Dorothy 1A |
|
Project Sophie |
|
Other |
|
Soluna Digital Subtotal |
|
Project Ada |
|
Total |
||||||||||||||
|
|
|
|
|
|
|
|
|
|
|
|
|
|
|
|
|
|
|
|
|
|
|||||||
Cryptocurrency mining revenue |
|
$ |
13,691 |
|
|
$ |
- |
|
|
$ |
- |
|
|
$ |
- |
|
|
$ |
13,691 |
|
|
$ |
- |
|
|
$ |
13,691 |
|
Data hosting revenue |
|
|
- |
|
|
|
10,623 |
|
|
|
3,823 |
|
|
|
- |
|
|
|
14,446 |
|
|
|
- |
|
|
|
14,446 |
|
Demand response services |
|
|
- |
|
|
|
- |
|
|
|
- |
|
|
|
1,612 |
|
|
|
1,612 |
|
|
|
- |
|
|
|
1,612 |
|
High-performance computing services |
|
|
- |
|
|
|
- |
|
|
|
- |
|
|
|
- |
|
|
|
- |
|
|
|
- |
|
|
|
- |
|
Total revenue |
|
|
13,691 |
|
|
|
10,623 |
|
|
|
3,823 |
|
|
|
1,612 |
|
|
|
29,749 |
|
|
|
- |
|
|
|
29,749 |
|
|
|
|
|
|
|
|
|
|
|
|
|
|
|
|
|
|
|
|
|
|
|
|
|
|
|
|
|
|
Cost of cryptocurrency mining, exclusive of depreciation |
|
$ |
5,687 |
|
|
|
- |
|
|
|
- |
|
|
|
- |
|
|
|
5,687 |
|
|
|
- |
|
|
|
5,687 |
|
Cost of data hosting revenue, exclusive of depreciation |
|
|
- |
|
|
|
5,520 |
|
|
|
1,452 |
|
|
|
10 |
|
|
|
6,982 |
|
|
|
- |
|
|
|
6,982 |
|
Cost of high-performance computing service revenue |
|
|
- |
|
|
|
- |
|
|
|
- |
|
|
|
- |
|
|
|
- |
|
|
|
2,859 |
|
|
|
2,859 |
|
Cost of cryptocurrency mining revenue- depreciation |
|
|
3,220 |
|
|
|
- |
|
|
|
- |
|
|
|
- |
|
|
|
3,220 |
|
|
|
- |
|
|
|
3,220 |
|
Cost of data hosting revenue- depreciation |
|
|
- |
|
|
|
867 |
|
|
|
453 |
|
|
|
- |
|
|
|
1,320 |
|
|
|
- |
|
|
|
1,320 |
|
Total cost of revenue |
|
|
8,907 |
|
|
|
6,387 |
|
|
|
1,905 |
|
|
|
10 |
|
|
|
17,209 |
|
|
|
2,859 |
|
|
|
20,068 |
|
Gross profit |
|
$ |
4,784 |
|
|
$ |
4,236 |
|
|
$ |
1,918 |
|
|
$ |
1,602 |
|
|
$ |
12,540 |
|
|
$ |
(2,859) |
|
|
$ |
9,681 |
|
EBITDA and Adjusted EBITDA Tables:
Reconciliations of EBITDA and Adjusted EBITDA to net loss, the most comparable GAAP financial metric, for historical periods are presented in the table below:
(Dollars in thousands) |
|
Three Months Ended September 30, |
|
Nine Months Ended September 30, |
||||||||||||
|
|
2025 |
|
2024 |
|
2025 |
|
2024 |
||||||||
|
|
|
|
|
|
|
|
|
|
|
|
|
||||
Net loss |
|
$ |
(25,787 |
) |
|
$ |
(8,093 |
) |
|
$ |
(40,921 |
) |
|
$ |
(19,782 |
) |
Interest expense |
|
|
1,212 |
|
|
|
821 |
|
|
|
3,246 |
|
|
|
1,694 |
|
Income tax benefit |
|
|
(666 |
) |
|
|
(547 |
) |
|
|
(1,697 |
) |
|
|
(1,743 |
) |
Depreciation and amortization |
|
|
4,119 |
|
|
|
3,916 |
|
|
|
11,985 |
|
|
|
11,749 |
|
EBITDA |
|
|
(21,122 |
) |
|
|
(3,903 |
) |
|
|
(27,387 |
) |
|
|
(8,082 |
) |
|
|
|
|
|
|
|
|
|
|
|
|
|
|
|
|
|
Adjustments: Non-cash items |
|
|
|
|
|
|
|
|
|
|
|
|
|
|
|
|
|
|
|
|
|
|
|
|
|
|
|
|
|
|
|
|
|
Stock-based compensation costs |
|
|
1,882 |
|
|
|
1,257 |
|
|
|
5,671 |
|
|
|
3,286 |
|
Loss on sale of fixed assets and credit on equipment deposit |
|
|
780 |
|
|
|
- |
|
|
|
802 |
|
|
|
21 |
|
Provision for credit losses |
|
|
- |
|
|
|
367 |
|
|
|
- |
|
|
|
611 |
|
Impairment on fixed assets |
|
|
- |
|
|
|
- |
|
|
|
12 |
|
|
|
130 |
|
Fair value adjustment loss (gain) |
|
|
22,047 |
|
|
|
(328 |
) |
|
|
22,165 |
|
|
|
5,607 |
|
Fair value on placement agent warrants financing fee |
|
|
146 |
|
|
|
- |
|
|
|
146 |
|
|
|
- |
|
(Gain) loss on debt extinguishment and revaluation, net |
|
|
(10,107 |
) |
|
|
(875 |
) |
|
|
(10,658 |
) |
|
|
1,888 |
|
Adjusted EBITDA |
|
$ |
(6,374 |
) |
|
$ |
(3,482 |
) |
|
$ |
(9,249 |
) |
|
$ |
3,461 |
|
The following table represents the Adjusted EBITDA activity between each three-month period from January 1, 2025 through September 30, 2025.
(Dollars in thousands) |
|
Three months ended March 31, 2025 |
|
Three months ended June 30, 2025 |
|
Three months ended September 30, 2025 |
||||||
|
|
|
|
|
|
|
|
|
|
|||
Net loss |
|
$ |
(7,354 |
) |
|
$ |
(7,780 |
) |
|
$ |
(25,787 |
) |
Interest expense, net |
|
|
838 |
|
|
|
1,196 |
|
|
|
1,212 |
|
Income tax (benefit) expense |
|
|
(425 |
) |
|
|
(608 |
) |
|
|
(666 |
) |
Depreciation and amortization |
|
|
3,879 |
|
|
|
3,989 |
|
|
|
4,119 |
|
EBITDA |
|
|
(3,062 |
) |
|
|
(3,203 |
) |
|
|
(21,122 |
) |
|
|
|
|
|
|
|
|
|
|
|
|
|
Adjustments: Non-cash items |
|
|
|
|
|
|
|
|
|
|
|
|
|
|
|
|
|
|
|
|
|
|
|
|
|
Stock-based compensation costs |
|
|
1,847 |
|
|
|
1,942 |
|
|
|
1,882 |
|
Loss (gain) on sale of fixed assets and credit on equipment deposit |
|
|
- |
|
|
|
22 |
|
|
|
780 |
|
Impairment on fixed assets |
|
|
- |
|
|
|
12 |
|
|
|
- |
|
Fair value adjustment loss |
|
|
118 |
|
|
|
- |
|
|
|
22,047 |
|
Fair value on placement agent warrant financing fees |
|
|
- |
|
|
|
- |
|
|
|
146 |
|
(Gain) loss on debt extinguishment and revaluation, net |
|
|
(551 |
) |
|
|
- |
|
|
|
(10,107 |
) |
Adjusted EBITDA |
|
$ |
(1,648 |
) |
|
$ |
(1,227 |
) |
|
$ |
(6,374 |
) |
The following table represents the Adjusted EBITDA activity between each three-month period from January 1, 2024 through December 31, 2024.
(Dollars in thousands) |
|
Three months
March 31, 2024 |
|
Three months
June 30, 2024 |
|
Three months
September 30, 2024 |
|
Three months
December 31, 2024 |
||||||||
|
|
|
|
|
|
|
|
|
|
|
|
|
||||
Net loss from continuing operations |
|
$ |
(2,544 |
) |
|
$ |
(9,145 |
) |
|
$ |
(8,093 |
) |
|
$ |
(38,518 |
) |
Interest expense, net |
|
|
424 |
|
|
|
449 |
|
|
|
821 |
|
|
|
833 |
|
Income tax benefit from continuing operations |
|
|
(548 |
) |
|
|
(649 |
) |
|
|
(547 |
) |
|
|
(743 |
) |
Depreciation and amortization |
|
|
3,926 |
|
|
|
3,909 |
|
|
|
3,916 |
|
|
|
3,889 |
|
EBITDA |
|
|
1,258 |
|
|
|
(5,436 |
) |
|
|
(3,903 |
) |
|
|
(34,539 |
) |
|
|
|
|
|
|
|
|
|
|
|
|
|
|
|
|
|
Adjustments: Non-cash items |
|
|
|
|
|
|
|
|
|
|
|
|
|
|
|
|
|
|
|
|
|
|
|
|
|
|
|
|
|
|
|
|
|
Stock-based compensation costs |
|
|
661 |
|
|
|
1,368 |
|
|
|
1,257 |
|
|
|
2,025 |
|
Loss on sale of fixed assets |
|
|
1 |
|
|
|
21 |
|
|
|
- |
|
|
|
9 |
|
Provision for credit losses |
|
|
- |
|
|
|
244 |
|
|
|
367 |
|
|
|
149 |
|
Convertible note inducement expense |
|
|
- |
|
|
|
- |
|
|
|
- |
|
|
|
388 |
|
Placement agent release expense |
|
|
- |
|
|
|
- |
|
|
|
- |
|
|
|
1,000 |
|
Loss on contract |
|
|
- |
|
|
|
- |
|
|
|
- |
|
|
|
28,593 |
|
Impairment on fixed assets |
|
|
130 |
|
|
|
- |
|
|
|
- |
|
|
|
- |
|
Fair value loss (gain) adjustment |
|
|
4,333 |
|
|
|
1,600 |
|
|
|
(328 |
) |
|
|
100 |
|
(Gain) loss) on debt extinguishment and revaluation, net |
|
|
(1,236 |
) |
|
|
4,000 |
|
|
|
(875 |
) |
|
|
(245 |
) |
Adjusted EBITDA |
|
$ |
5,147 |
|
|
$ |
1,797 |
|
|
$ |
(3,482 |
) |
|
$ |
(2,520 |
) |
View source version on businesswire.com: https://www.businesswire.com/news/home/20251117209594/en/
Contacts
Investor Relations
Soluna Holdings, Inc.
ir@soluna.io


