
First Half 2024 Results
Further market share gains
Upgrading guidance
July 18, 2024
- H1 2024 net revenue organic growth of +5.4%; +7.4% on a like-for-like revenue basis
- Stronger than expected Q2 net revenue organic growth at +5.6%
- Accelerating versus 4Y Q2 CAGR of 4.7%
- Gaining market share with c. 400 bps1 outperformance versus peer average
- Solid performance across all regions in Q2:
- Continued momentum in the U.S. at +5.3%
- Robust Europe at +4.2% on top of a high comparable
- Strong APAC at +7.7%, with China accelerating to +10.5%
- Operating margin rate at record H1 level of 17.3%, including AI investment
- Headline diluted EPS up +5.3% at €3.38, Free cash flow2 up at €744m
- Upgrading full year 2024 net revenue organic growth to +5-6% vs +4-5% previously, despite persistent macro uncertainties
- Maintaining industry-high 2024 financial KPIs: Operating margin at 18.0%, Free cash flow2 between €1.8bn-1.9bn
| Q2 2024 | |
| Net revenue | €3,458m |
| Reported growth | +6.8% |
| Organic growth | +5.6% |
| H1 2024 Results | ||
| (EUR million) | H1 2024 | 2024 vs 2023 |
| Revenue | 7,650 | +7.7% |
| Net revenue | 6,688 | +5.9% |
| Organic growth | +5.4% | |
| Operating margin | 1,160 | +6.1% |
| Operating margin rate | 17.3% | |
| Headline Groupe net income | 857 | +5.4% |
| Headline diluted EPS (euro) | 3.38 | +5.3% |
| Free cash flow2 | 744 | +2.6% |
1 Based on consensus
2 Before change in working capital requirements
Arthur Sadoun, Chairman and CEO of Publicis Groupe:
“Publicis achieved a very strong first half of the year, with net revenue organic growth at +5.4% and +7.4% growth on a like-for-like revenue basis.
We continued to win market share, with Q2 net revenue organic growth accelerating to +5.6%, above expectations and 400bps ahead of our industry.
For the first 6 months of the year, we kept delivering industry leading financial KPIs.
Despite a backdrop of ongoing macro-economic pressures, not only did our H1 performance demonstrate that our model is strong. It also showed that our outperformance versus our peers is sustainable, with our growth rate close to doubling that of our competitors since 2019.
As a result, we are confident in our ability to accelerate further in H2.
We are raising our net revenue organic growth guidance and now expect to deliver between +5-+6%. We will maintain our best-in-class financial ratios while continuing to make material investments in our talent and AI strategy.
As we further extract ourselves from the pack, we have everything we need to continue to lead and reinvent our industry thanks to our transformation.
We have a winning go to market, which has put us at the head of the new business rankings for the past five years. We have taken the leadership of personalization at scale, demonstrated by our combined Data and Media offering’s double-digit growth this quarter, for the third year in a row. And thanks to Publicis Sapient, we are uniquely positioned to partner with our clients in their AI-led transformation.
I would like to take this opportunity to thank all of our clients for their trust. I would also like to thank our people around the world for their outstanding work. Sustaining these levels of outperformance in such a difficult environment is an everyday battle and with the Executive Committee we are truly grateful for all of their efforts.”
. .
.
The Publicis Board of Directors met on July 17, 2024 under the chairmanship of Arthur Sadoun and approved the financial statements for the first half of 2024.
KEY FIGURES
| EUR million, except per-share data and percentages | H1 2024 | H1 2023 | 2024 vs 2023 |
| Data from the Income statement and Cash flow statement | |||
| Net revenue | 6,688 | 6,318 | +5.9% |
| Pass-through revenue | 962 | 787 | +22.2% |
| Revenue | 7,650 | 7,105 | +7.7% |
| EBITDA | 1,401 | 1,335 | +4.9% |
| % of net revenue | 20.9% | 21.1% | -20bps |
| Operating margin | 1,160 | 1,093 | +6.1% |
| % of net revenue | 17.3% | 17.3% | 0bps |
| Operating income | 1,008 | 843 | +19.6% |
| Net income attributable to the Groupe | 773 | 623 | +24.1% |
| Earnings per share (EPS) | 3.08 | 2.48 | +24.2% |
| Headline diluted EPS3 | 3.38 | 3.21 | +5.3% |
| Free cash flow before change in working capital requirements | 744 | 725 | +2.6% |
| Data from the Balance sheet | June 30, 2024 | Dec 31, 2023 | |
| Total assets | 35,918 | 36,716 | |
| Groupe share of Shareholders’ equity | 9,916 | 9,788 | |
| Net debt (net cash) | 99 | (909) |
3 Net income attributable to the Groupe, after elimination of impairment charges, amortization of intangibles arising on acquisitions, the main capital gains (or losses) on disposals, change in the fair value of financial assets, the revaluation of earn-out costs, divided by the average number of shares on a diluted basis
NET REVENUE IN Q2 2024
Publicis Groupe’s net revenue in Q2 2024 was 3,458 million euros, up +6.8% from 3,239 million euros in 2023. Exchange rates had a small positive impact of 13 million euros. Acquisitions, net of disposals, accounted for an increase in net revenue of 25 million euros. Organic growth reached +5.6%.
Breakdown of Q2 2024 net revenue by region
| EUR | Net revenue | Reported | Organic | |
| million | Q2 2024 | Q2 2023 | growth | growth |
| North America | 2,104 | 1,955 | +7.6% | +5.2% |
| Europe | 856 | 809 | +5.8% | +4.2% |
| Asia Pacific | 306 | 300 | +2.0% | +7.7% |
| Middle East & Africa | 100 | 91 | +9.9% | +9.1% |
| Latin America | 92 | 84 | +9.5% | +18.9% |
| Total | 3,458 | 3,239 | +6.8% | +5.6% |
North America net revenue was up +7.6% on a reported basis, including a positive impact of the U.S. dollar to euro exchange rate. Organic growth in the region was +5.2%. In the U.S., organic growth came at +5.3%, with Media and Epsilon continuing to be accretive this quarter, confirming the strength of our integrated offer in this geography where our model is the most advanced. Media grew double-digits, on top of double-digit growth over the last two years, while Epsilon posted mid-single digit growth mainly led by Digital Media and Data activities. Publicis Sapient posted a slight decline on top of a solid +5% in Q2 2023, in a context of continued “wait and see” attitude from clients. Creative activities were broadly stable.
Net revenue in Europe was up by +5.8% on a reported basis and +4.2% organically. Organic growth in the U.K. was broadly stable, with double-digit growth in Media and Creative. Organic growth in France was +4.2% led by mid-single-digit growth in Media while Publicis Sapient faced a challenging comparable base. Germany posted +3.4% organic growth driven by Media and Publicis Sapient. Central & Eastern Europe was very strong at +17.4% organically, with double-digit growth in most countries, led by both Media and Creative.
Net revenue in Asia Pacific recorded +2.0% growth on a reported basis and +7.7% on an organic basis. China accelerated to +10.5% organic growth after +6.7% in Q1 2024, benefitting from new business wins in Media. South-East Asia posted high-single-digit growth, fueled by Thailand, India and Malaysia. Australia was up by a low-single-digit, improving sequentially from Q1 2024.
In Middle East & Africa, net revenue was up +9.9% on a reported basis, and +9.1% organically, largely driven by double-digit-growth in Media and Publicis Sapient.
Net revenue in Latin America was up +9.5% on a reported basis, and +18.9% organically, led by both Media and Creative, notably in Brazil, Mexico and Colombia.
NET REVENUE IN H1 2024
Publicis Groupe’s net revenue for the first half of 2024 was 6,688 million euros, up by 5.9% compared to 6,318 million euros in the first half of 2023. Exchange rate variations over the period had a small negative impact of 16 million euros. Acquisitions (net of disposals) had a positive impact of 43 million euros on net revenue. Organic growth was +5.4% in the first half of 2024.
Breakdown of H1 2024 net revenue by sector
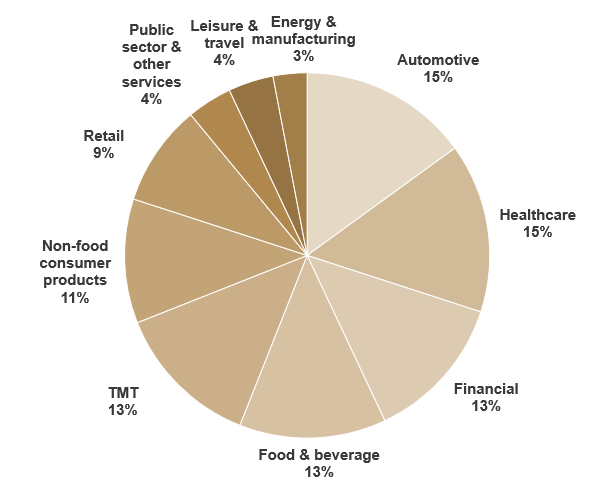 |
On the basis of 3,266 main clients representing 92% of Groupe net revenue
Breakdown of H1 2024 net revenue by region
| EUR | Net revenue | Reported | Organic | |
| million | H1 2024 | H1 2023 | growth | growth |
| North America | 4,112 | 3,893 | +5.6% | +5.0% |
| Europe | 1,649 | 1,552 | +6.3% | +5.1% |
| Asia Pacific | 572 | 550 | +4.0% | +7.0% |
| Middle East & Africa | 190 | 179 | +6.1% | +6.6% |
| Latin America | 165 | 144 | +14.6% | +14.0% |
| Total | 6,688 | 6,318 | +5.9% | +5.4% |
Net revenue in North America was up by +5.0% on an organic basis in the first half of 2024 (+5.6% on a reported basis). The U.S. performed strongly with +5.2% organic growth.
Europe posted +5.1% organic growth in the first half (+6.3% on a reported basis). The U.K. was broadly stable, France at +6.6%, Germany at +4.1% and Central & Eastern Europe at +19.2% on an organic basis.
Asia Pacific net revenue was up by +7.0% on an organic basis (+4.0% on a reported basis). China reported an organic growth of +8.9%, and Australia was up by +1.3% on an organic basis.
Net revenue in the Middle East & Africa region was up by +6.6% on an organic basis (+6.1% on a reported basis) and up by +14.0% in Latin America (+14.6% on a reported basis).
ANALYSIS OF H1 2024 KEY FIGURES
Income statement
EBITDA amounted to 1,401 million euros in H1 2024, compared to 1,335 million euros in H1 2023, up by +4.9%. This represents 20.9% of net revenue.
Personnel costs totaled 4,498 million euros in H1 2024 from 4,200 million euros in H1 2023, an increase of +7.1%. As a percentage of net revenue, personnel expenses were 67.3% in H1 2024, versus 66.5% in H1 2023. Fixed personnel costs were 4,006 million euros and represented 59.9% of net revenue versus 59.0% in H1 2023, the increase being largely attributable to the AI investment. The cost of freelancers remained stable compared to H1 2023 in percentage of net revenue, representing 174 million euros in H1 2024. Restructuring costs were 41 million euros, slightly down versus 45 million euros in H1 2023.
Non personel costs amounted to 1,030 million euros in H1 2024, compared to 1,025 million euros in H1 2023. This represented 15.4% of net revenue in H1 2024 versus 16.2% of net revenue in H1 2023, improving by 80 basis points. They comprised:
- Other operating expenses (excluding pass-through costs, depreciation & amortization) amounted to 789 million euros, compared to 783 million euros in H1 2023. They represent 11.8% of net revenue, compared to 12.4% in H1 2023, reflecting solid cost control.
- Depreciation and amortization charge was 241 million euros in H1 2024, stable compared to 242 million euros in H1 2023.
As a result, the operating margin amounted to 1,160 million euros, up by +6.1% compared to H1 2023. This represents an operating margin rate of 17.3% in H1 2024, in line with H1 2023, while including circa 45 million euros relating to the Groupe’s AI investment.
Operating margin rates by geographies were 18.7% in North America, 16.1% in Europe, 19.6% in Asia-Pacific, 3.7% in Middle East & Africa and 3.6% in Latin America.
Amortization of intangibles arising from acquisitions totaled 123 million euros in H1 2024, down 19 million euros versus H1 2023, related to the end of the amortization associated with technologies.
Impairment losses amounted to 45 million euros, down from 112 millions euros in H1 2023, as 2023 included the impact of our real estate footprint optimization.
In addition, non-current expense was an income of 16 million euros, mainly corresponding to the contribution of the CitrusAd and Epsilon technologies to the Group's 49%-owned associate Unlimitail. In H1 2023, non-current income amounted to 4 million euros.
Operating income totaled 1,008 million euros in H1 2024, versus 843 million euros in H1 2023.
The financial result, comprising the cost of net financial debt and other financial charges and income, was at 0 million euro in H1 2024, compared to a charge of 14 million euros in H1 2023.
- The cost of net financial debt was an income of 39 million euros in H1 2024, compared to an income of 42 million euros in H1 2023. In H1 2024, it included 61 million euros of financial expenses (59 million euros in H1 2023) and financial income of 100 million euros, broadly stable versus last year.
- Other financial income and expenses were a charge of 39 million euros in H1 2024, notably composed by 42 million euros interest on lease liabilities and 7 million euros income from the fair value remeasurement of mutual funds. In H1 2023, other financial income and expenses were a charge of 56 million euros, notably composed by 39 million euros interest on lease liabilities and 8 million euros cost from the fair value remeasurement of Mutual Funds.
The revaluation for earn-outs payments was an income of 28 million euros in H1 2024, compared to 1 million euros income in H1 2023.
The income tax charge was 256 million euros in H1 2024, corresponding to a forecasted effective tax rate of 24.9% for 2024, compared to 205 million euros in H1 2023 corresponding to a forecasted effective tax rate of 24.8% for 2023.
The share of profit of associates is a 3 million euros loss in H1 2024, compared to a 3 million euros profit in H1 2023.
Minority interests were a gain of 4 million euros in H1 2024 compared to a gain of 5 million euros in Groupe results in H1 2023.
Overall, net income attributable to the Groupe was 773 million euros in H1 2024, compared to 623 million euros in H1 2023.
Finally the earning per share was 3.08 euros in H1 2024, compared to 2.48 euros in H1 2023, up by +24.2%.
Free cash flow
| EUR million | H1 2024 | H1 2023 |
| EBITDA | 1,401 | 1,335 |
| Repayment of lease liabilities and related interests | (224) | (207) |
| Investments in fixed assets (net) | (118) | (75) |
| Financial interest paid (net) | 13 | 17 |
| Tax paid | (376) | (386) |
| Other | 48 | 41 |
| Free cash flow before changes in WCR | 744 | 725 |
The Groupe’s free cash flow, before change in working capital requirements, is up by 19 million euros compared to H1 2023, to 744 million euros.
Repayment of lease liabilities and related interests amounted to 224 million euros in H1 2024, compared to 207 million euros in H1 2023.
Net investments in fixed assets were 118 million euros in H1 2024, up 43 million compared to 75 million euros in H1 2023, reflecting higher investment in platforms and cloud infrastructure, the cost related to ERP deployment across the entire organization, as well as costs associated with new leases.
Financial interest were an income of 13 million euros in H1 2024, compared to an income of 17 million euros in H1 2023.
Tax paid amounted to 376 million euros, down 10 million euros compared to H1 2023. In January 2023, the Group made an additional payment of 110 million euros related to fiscal year 2022, reflecting the implementation of the Tax Cuts and Jobs Act (TCJA) in the United States. However, this impact was largely offset by an increase in taxes paid in H1 2024, due to various items including true-ups on 2023 tax and withholding tax.
Net debt
Net financial debt amounted to 99 million euros as of June 30, 2024 compared to a net cash position of 909 million euros of December 31, 2023 reflecting the seasonality of the activity. The Groupe's last twelve months average net debt as of June 30, 2024 amounted to 375 million euros compared to 498 million euros as of June 30, 2023.
ACQUISITIONS
On January 18, 2024, Publicis Groupe Singapore announced the acquisition of AKA Asia, one of Singapore's leading integrated communications agencies. Founded in 2009, AKA is a highly respected player in the South-East Asian market, known for delivering award-winning and innovative communication campaigns. The acquisition will expand and diversify Publicis Groupe's capabilities in the region, while bolstering the Groupe's strategic communications, PR and influence offering. AKA will join the Groupe's regional Influence practice.
On March 12, 2024, Publicis Sapient announced the acquisition of Spinnaker SCA, a leading supply chain services firm that provides end-to-end supply chain strategy, planning and execution consulting services. Founded in 2002 and based in Boulder in the U.S., Spinnaker SCA will become part of Publicis Sapient and bring core capabilities and skill sets including advanced AI and ML analytics, supply chain digital twins, warehouse and transportation management and expanded digital services. Spinnaker SCA will further enable Publicis Sapient to offer solutions for clients to optimize their agile supply chains as part of their digital business transformation.
On June 5, 2024, Publicis Groupe in France announced the acquisition of Downtown Paris, a creation and production house specialized in leading brands in the beauty and luxury business. Founded in 2016, the agency will strengthen the production vertical of Publicis France and will work with the Groupe's various luxury entities.
CSR
In May 2024, the Groupe announced the arrival of Nannette LaFond-Dufour as Chief Impact Officer. In this newly created global role, Nannette will be responsible for driving immediate impact across the Groupe’s long-term ESG commitments. These include Publicis’ ambitious SBTI-approved climate goals, its concrete diversity, equity and inclusion action plans, as well as its flagship initiatives like the Working with Cancer pledge and the Women’s Forum for the Economy & Society.
GOVERNANCE
The Combined General Shareholder’s meeting of Publicis Groupe SA, held on May 29, 2024, approved the change in the Company's governance structure to adopt a Board of Directors, replacing the previous Management Board and Supervisory Board.
The Board of Directors, which met following the General Meeting, agreed to combine the roles of Chairman and Chief Executive Officer, appointing Mr. Arthur Sadoun as Chairman and CEO.
Mrs. Élisabeth Badinter was appointed Vice-Chair of the Board of Directors.
Mr. Maurice Lévy has taken on the role of Chairman Emeritus of Publicis Groupe and is invited to attend Board meetings.
Mr. André Kudelski was appointed to the position of Lead Director (Administrateur Référent). In this role, his primary missions are to facilitate the smooth operation of the Company’s governing bodies alongside the Chairman of the Board; preside over executive sessions; guard against potential conflicts of interest; and supervise the evaluation process of the Board of Directors.
All the proposed amendments to the Articles of Incorporation were approved, as was the extension of the Company’s term.
POST-REPORTING PERIOD EVENTS
On July 12, 2024, the Groupe put a new Revolving Credit Facility in place for an amount of 2,000 million euros with a maturity of July 2029 (and a two-year extension option). This facility cancels and replaces the confirmed credit facility of 1,579 million euros, maturing in 2026.
OUTLOOK
After a better than expected first half of 2024, which demonstrated the strength of the Groupe’s model and the sustainability of its industry outperformance, the Groupe is confident in its potential to accelerate further on organic growth in the second half of the year, and upgrades its organic growth guidance for the full year 2024 despite ongoing macroeconomic uncertainties.
The Groupe now aims for +5% to +6% organic growth for the full year, compared to +4% to +5% previously.
The bottom-end of the guidance at +5% is the new floor in the current macroeconomic environment, factoring in continued delays in clients’ digital business transformation projects and reduced spend in classic advertising.
The top-end of the guidance at +6% is the new stretch, assuming an improved macroeconomic context, which would lead to resumed spend on digital business transformation projects, fewer reductions in classic advertising and some positive impact from increased client budgets in the fourth quarter.
The Groupe also confirms its 2024 guidance on financial ratios, which will be maintained at the industry-leading levels of 18% operating margin rate and between 1.8 and 1.9 billion euros free cash flow before change in working capital, including the Groupe’s opex investment of 100 million euros for its AI plan.
Disclaimer
Certain information contained in this document, other than historical information, may constitute forward-looking statements or unaudited financial forecasts. These forward-looking statements and forecasts are subject to risks and uncertainties that could cause actual results to differ materially from those projected. These forward-looking statements and forecasts are presented at the date of this document and, other than as required by applicable law, Publicis Groupe does not assume any obligation to update them to reflect new information or events or for any other reason. Publicis Groupe urges you to carefully consider the risk factors that may affect its business, as set out in the Universal Registration Document filed with the French Autorité des Marchés Financiers (AMF) and which is available on the website of Publicis Groupe (www.publicisgroupe.com), including an unfavorable economic climate, a highly competitive industry, risks associated with the confidentiality of personal data, the Groupe’s business dependence on its management and employees, risks associated with mergers and acquisitions, risks of IT system failures and cybercrime, the possibility that our clients could seek to terminate their contracts with us on short notice, risks associated with the reorganization of the Groupe, risks of litigation, governmental, legal and arbitration proceedings, risks associated with the Groupe’s financial rating and exposure to liquidity risks.
About Publicis Groupe - The Power of One
Publicis Groupe [Euronext Paris FR0000130577, CAC 40] is a global leader in communication. The Groupe is positioned at every step of the value chain, from consulting to execution, combining marketing transformation and digital business transformation. Publicis Groupe is a privileged partner in its clients’ transformation to enhance personalization at scale. The Groupe relies on ten expertise concentrated within four main activities: Communication, Media, Data and Technology. Through a unified and fluid organization, its clients have a facilitated access to all its expertise in every market. Present in over 100 countries, Publicis Groupe employs around 103,000 professionals.
www.publicisgroupe.com | Twitter: @PublicisGroupe | Facebook | LinkedIn | YouTube | Viva la Difference!
| Contacts Publicis Groupe | |||
| Amy Hadfield | Corporate Communications | + 33 1 44 43 70 75 | amy.hadfield@publicisgroupe.com |
| Jean-Michel Bonamy | Investor Relations | + 33 1 44 43 74 88 | jean-michel.bonamy@publicisgroupe.com |
| Lorène Fleury | Investor Relations | + 33 1 44 43 57 24 | lorene.fleury@publicisgroupe.com |
| Maxine Miller | Investor Relations | + 33 1 44 43 74 21 | maxine.miller@publicisgroupe.com |
Please find the press release here
Appendices
Net revenue: organic growth calculation
| (million euro) | Q1 | Q2 | H1 | Impact of currency at end June 2024 (million euro) | ||
| 2023 net revenue | 3,079 | 3,239 | 6,318 | GBP (2) | 15 | |
| Currency impact (2) | (29) | 13 | (16) | USD (2) | (1) | |
| 2023 net revenue at 2024 exchange rates (a) | 3,050 | 3,252 | 6,302 | Others | (30) | |
| 2024 net revenue before acquisition impact (b) | 3,212 | 3,433 | 6,645 | Total | (16) | |
| Net revenue from acquisitions (1) | 18 | 25 | 43 | |||
| 2024 net revenue | 3,230 | 3,458 | 6,688 | |||
| Organic growth (b/a) | +5.3% | +5.6% | +5.4% | |||
(1) Acquisitions (Spinnaker SCA, Practia, Corra, AKA Asia, ARBH, Downtown Paris), net of disposals.
(2) EUR = USD 1.081 on average in H1 2024 vs. USD 1.081 on average in H1 2023
EUR = GBP 0.855 on average in H1 2024 vs. GBP 0.877 on average in H1 2023
Definitions
Net revenue or Revenue less pass-through costs: Pass-through costs mainly concern production and media activities, as well as various expenses incumbent on clients. These items that can be re-billed to clients do not come within the scope of assessment of operations, net revenue is a more relevant indicator to measure the operational performance of the Groupe’s activities.
Organic growth: Change in net revenue excluding the impact of acquisitions, disposals and currencies.
Like-for-like growth: Growth at current year exchange rates and current perimeter, including organic growth coming from acquisitions since the acquisition date.
4Y CAGR organic growth: Calculated as: ( [1 + organic growth (n-4)]*[1 + organic growth (n-3)]*[1 + organic growth (n-2)]*[1 + organic growth (n-1)] )^(1/4) - 1.
EBITDA (Earnings Before Interest, Taxes, Depreciation and Amortization): Operating margin before depreciation & amortization.
Operating margin: Revenue after personnel costs, other operating expenses (excl. non-current income and expense) and depreciation (excl. amortization of intangibles arising on acquisitions).
Operating margin rate: Operating margin as a percentage of net revenue.
Headline Group Net Income: Net income attributable to the Groupe, after elimination of impairment charges / real estate transformation expenses, amortization of intangibles arising on acquisitions, the main capital gains (or losses) on disposals, change in the fair value of financial assets and the revaluation of earn-out costs.
EPS (Earnings per share): Group net income divided by average number of shares, not diluted.
EPS, diluted (Earnings per share, diluted): Group net income divided by average number of shares, diluted.
Headline EPS, diluted (Headline Earnings per share, diluted): Headline group net income, divided by average number of shares, diluted.
Capex: Net acquisitions of tangible and intangible assets, excluding financial investments and other financial assets.
Free cash flow before changes in working capital requirements: Net cash flow from operating activities less interests paid & received, repayment of lease liabilities & related interests and before changes in WCR linked to operating activities.
Free cash flow: Net cash flow from operating activities less interests paid & received, repayment of lease liabilities & related interests.
Net debt (or financial net debt): Sum of long and short financial debt and associated derivatives, net of treasury and cash equivalents, excluding lease liability since 1st January 2018.
Average net debt: Last twelve month average of monthly net debt at end of month.
Dividend pay-out: Dividend per share / Headline diluted EPS.
Consolidated income statement
| (in millions of euros) | 30 June 30, 2024 (6 months) (6 months) | 30 June 30, 2023 (6 months) (6 months) | December 31, 2023 (12 months) | ||
| Net revenue (*) | 6,688 | 6,318 | 13,099 | ||
| Pass-through revenue | 962 | 787 | 1,703 | ||
| Revenue | 7,650 | 7,105 | 14,802 | ||
| Personnel costs Other operating costs | (4,498) (1,751) | (4,200) (1,570) | (8,514) (3,443) | ||
| Operating margin before depreciation & amortization | 1,401 | 1,335 | 2,845 | ||
| Depreciation and amortization (excluding intangibles from acquisitions) | (241) | (242) | (482) | ||
| Operating margin | 1,160 | 1,093 | 2,363 | ||
| Amortization of intangibles from acquisitions | (123) | (142) | (268) | ||
| Impairment loss | (45) | (112) | (153) | ||
| Other non-current income and expenses | 16 | 4 | (202) | ||
| 1 434 | |||||
| Operating income | 1,008 | 843 | 1,740 | ||
| Financial expense Financial income Cost of net financial debt Other financial income and expenses Revaluation of earn-out payments | (61) 100 39 (39) 28 | (59) 101 42 (56) 1 | (120) 198 78 (99) 12 | ||
| Pre-tax income of consolidated companies | 1,036 | 830 | 1,731 | ||
| Income taxes | (256) | (205) | (415) | ||
| Net income of consolidated companies | 780 | 625 | 1,316 | ||
| Share of profit of associates | (3) | 3 | 6 | ||
| Net income | 777 | 628 | 1,322 | ||
| Of which: - Net income attributable to non-controlling interests | 4 | 5 | 10 | ||
| Net income attributable to equity holders of the parent company | 773 | 623 | 1,312 | ||
| Per share data (in euros) - Net income attributable to equity holders of the parent company | | |||
| Number of shares | 250,711,640 | 250,829,338 | 250,706,485 | |
| Earnings per share | 3.08 | 2.48 | 5.23 | |
| Number of diluted shares | 253,302,880 | 253,618,058 | 253,999,363 | |
| Diluted earnings per share | 3.05 | 2.46 | 5.17 |
(*) Net revenue: Revenue less pass-through costs. Those costs are mainly production & media costs and out-of-pocket expenses. As these items that can be passed on to clients are not included in the scope of analysis of transactions, the net revenue indicator is the most appropriate for measuring the Groupe’s operational performance.
Consolidated statement of comprehensive income
| (in millions of euros) | June 30, 2024 (6 months) | June 30, 2023 (6 months) | December 31, 2023 (12 months) | |
| Net income for the period (a) | 777 | 628 | 1,322 | |
| Comprehensive income that will not be reclassified to income statement | ||||
| - Actuarial gains (and losses) on defined benefit plans | 18 | (6) | 12 | |
| - Deferred taxes on comprehensive income that will not be reclassified to income statement | (4) | 2 | (3) | |
| Comprehensive income that may be reclassified to income statement | ||||
| - Remeasurement of hedging instruments | 19 | 13 | 34 | |
| - Consolidation translation adjustments | 239 | (217) | (390) | |
| Total other comprehensive income (b) | 272 | (208) | (347) | |
| Total comprehensive income for the period (a) + (b) | 1,049 | 420 | 975 | |
| Of which: | ||||
| - Comprehensive income for the period attributable to non-controlling interests | 4 | (2) | 4 | |
| - Comprehensive income for the period attributable to equity holders of the parent company | 1,045 | 422 | 971 |
Consolidated balance sheet
| (in millions of euros) | June 30, 2024 | December 31, 2023 | |
| Assets | |||
| Goodwill, net | 12,812 | 12,422 | |
| Intangible assets, net | 901 | 958 | |
| Right-of-use assets related to leases | 1,640 | 1,614 | |
| Property, plant and equipment, net | 591 | 596 | |
| Deferred tax assets | 173 | 212 | |
| Investments in associates | 80 | 46 | |
| Other financial assets | 316 | 316 | |
| Non-current assets | 16,513 | 16,164 | |
| Inventories and work-in-progress | 482 | 341 | |
| Trade receivables | 12,883 | 13,400 | |
| Contract assets | 1,860 | 1,297 | |
| Other receivables and current assets | 1,098 | 1,264 | |
| Cash and cash equivalents | 3,082 | 4,250 | |
| Current assets | 19,405 | 20,552 | |
| Total assets | 35,918 | 36,716 |
| Equity and liabilities | |||
| Share capital | 102 | 102 | |
| Additional paid-in capital and retained earnings, Groupe share | 9,814 | 9,686 | |
| Equity attributable to holders of the parent company – Groupe share | 9,916 | 9,788 | |
| Non-controlling interests (minority interests) | (41) | (40) | |
| Total equity | 9,875 | 9,748 | |
| Long-term borrowings | 1,650 | 2,462 | |
| Long-term lease liabilities | 1,990 | 1,992 | |
| Deferred tax liabilities | 63 | 98 | |
| Pension commitments and other short-term benefits | 260 | 265 | |
| Long-term provisions | 365 | 319 | |
| Non-current liabilities | 4,328 | 5,136 | |
| Trade payables | 15,953 | 17,077 | |
| Contract liabilities | 481 | 513 | |
| Short-term borrowings | 1,382 | 726 | |
| Short-term lease liabilities | 372 | 360 | |
| Income taxes payable | 302 | 378 | |
| Pension commitments and other short-term benefits | 24 | 21 | |
| Short-term provisions | 207 | 255 | |
| Other creditors and current liabilities | 2,994 | 2,502 | |
| Current liabilities | 21,715 | 21,832 | |
| Total equity and liabilities | 35,918 | 36,716 |
Consolidated statement of cash flows
| (in millions of euros) | | June 30, 2024 (6 months) | June 30, 2023 (6 months) | December 31, 2023 (12 months) |
| Cash flow from operating activities | ||||
| Net income | 777 | 628 | 1,322 | |
| Neutralization of non-cash income and expenses: | ||||
| Income taxes | 256 | 205 | 415 | |
| Cost of net financial debt | (39) | (42) | (78) | |
| Capital losses (gains) on disposal of assets (before tax) | (16) | (2) | (1) | |
| Depreciation, amortization and impairment losses | 409 | 496 | 903 | |
| Share-based compensation | 46 | 41 | 85 | |
| Other non-cash income and expenses | 12 | 51 | 79 | |
| Share of profit of associates | 3 | (3) | (6) | |
| Dividends received from associates | 1 | 2 | 7 | |
| Taxes paid | (376) | (386) | (669) | |
| Change in working capital requirements | (1,629) | (1,053) | (9) | |
| Net cash flows generated by (used in) operating activities (I) | (556) | (63) | 2,048 | |
| Cash flow from investing activities | ||||
| Purchases of property, plant and equipment and intangible assets | (120) | (75) | (180) | |
| Disposals of property, plant and equipment and intangible assets | 2 | - | 2 | |
| Purchases of investments and other financial assets, net | 12 | (10) | 13 | |
| Acquisitions of subsidiaries | (229) | (158) | (194) | |
| Disposals of subsidiaries | - | - | 11 | |
| Net cash flows generated by (used in) investing activities (II) | (335) | (243) | (348) | |
| Cash flow from financing activities | ||||
| Dividends paid to holders of the parent company | - | - | (726) | |
| Dividends paid to non-controlling interests | (9) | (7) | (9) | |
| Proceeds from new borrowings | - | 4 | 5 | |
| Repayment of borrowings | (5) | - | (502) | |
| Repayment of lease liabilities | (182) | (168) | (344) | |
| Interest paid on lease liabilities | (42) | (39) | (79) | |
| Interest paid | (85) | (86) | (99) | |
| Interest received | 98 | 103 | 192 | |
| Buy-outs of non-controlling interests | (7) | (2) | (4) | |
| Net (buybacks)/sales of treasury shares and warrants | (119) | (193) | (189) | |
| Net cash flows generated by (used in) financing activities (III) | (351) | (388) | (1,755) | |
| Impact of exchange rate fluctuations (IV) | 74 | (239) | (311) | |
| Change in consolidated cash and cash equivalents (I + II + III + IV) | (1,168) | (933) | (366) | |
| Cash and cash equivalents on January 1 | 4,250 | 4,616 | 4,616 | |
| Bank overdrafts on January 1 | (1) | (1) | (1) | |
| Net cash and cash equivalents at beginning of year (V) | 4,249 | 4,615 | 4,615 | |
| Cash and cash equivalents at closing date | 3,082 | 3,682 | 4,250 | |
| Bank overdrafts at closing date | (1) | - | (1) | |
| Net cash and cash equivalents at closing date (VI) | 3,081 | 3,682 | 4,249 | |
| Change in consolidated cash and cash equivalents (VI - V) | (1,168) | (933) | (366) | |
Consolidated statement of changes in equity
| Number of outstanding shares | (in millions of euros) | Share capital | Additional paid-in capital | Reserves and earnings brought forward | Translation reserve | Fair value reserve | Equity attributable to equity holders of the parent company | Non-controlling interests | Total equity | |
| 250,574,493 | January 1, 2024 | 102 | 3,336 | 6,633 | (299) | 16 | 9,788 | (40) | 9,748 | |
| Net income | 773 | 773 | 4 | 777 | ||||||
| Other comprehensive income, net of tax | 14 | 239 | 19 | 272 | - | 272 | ||||
| Total income and expenses for the period | 787 | 239 | 19 | 1,045 | 4 | 1,049 | ||||
| - | Dividends | (53) | (800) | (853) | (9) | (862) | ||||
| - | Share-based compensation, net of tax | 60 | 60 | 60 | ||||||
| Effect of acquisitions and commitments to buy-out non-controlling interests | (5) | (5) | 4 | (1) | ||||||
| - | Equity warrant exercise | - | - | - | ||||||
| 416,958 | (Buybacks)/Sales of treasury shares | (119) | (119) | (119) | ||||||
| 250,991,451 | June 30, 2024 | 102 | 3,283 | 6,556 | (60) | 35 | 9,916 | (41) | 9,875 |
| Number of outstanding shares | (in millions of euros) | Share capital | Additional paid-in capital | Reserves and earnings brought forward | Translation reserve | Fair value reserve | Equity attributable to equity holders of the parent company | Non-controlling interests | Total equity | |
| 251,992,065 | January 1, 2023 | 102 | 4,037 | 5,324 | 85 | 87 | 9,635 | (35) | 9,600 | |
| Net income | 623 | 623 | 5 | 628 | ||||||
| Other comprehensive income, net of tax | (210) | 9 | (201) | (7) | (208) | |||||
| Total income and expenses for the period | 0 | 0 | 623 | (210) | 9 | 422 | (2) | 420 | ||
| - | Dividends | (701) | (25) | (726) | (7) | (733) | ||||
| - | Share-based compensation, net of tax | 50 | 50 | 50 | ||||||
| Effect of acquisitions and commitments to buy-out non-controlling interests | 1 | 1 | 0 | 1 | ||||||
| - | Equity warrant exercise | 0 | 0 | 0 | ||||||
| (1,490,149) | (Buybacks)/Sales of treasury shares | (194) | (194) | (194) | ||||||
| 250,501,916 | June 30, 2023 | 102 | 3,336 | 5,779 | (125) | 96 | 9,188 | (44) | 9,144 |
Earnings per share (basic and diluted)
| (in millions of euros, except for share data) | June 30, 2024 | June 30, 2023 | |
| Net income used for the calculation of earnings per share | |||
| Net income share attributable to equity holders of the parent company | A | 773 | 623 |
| Impact of dilutive instruments: | |||
| - Savings in financial expenses related to the conversion of debt instruments, net of tax | - | - | |
| Net income – Groupe share – diluted | B | 773 | 623 |
| Number of shares used to calculate earnings per share | |||
| Number of shares at January 1 | 254,311,860 | 254,311,860 | |
| Shares created over the period | - | - | |
| Treasury shares to be deducted (average for the period) | (3,600,220) | (3,482,522) | |
| Average number of shares used for the calculation | C | 250,711,640 | 250,829,338 |
| Impact of dilutive instruments: | |||
| - Free shares and dilutive stock options | 2,591,240 | 2,788,720 | |
| - Equity warrants (BSA) | - | - | |
| Number of diluted shares | D | 253,302,880 | 253,618,058 |
| (in euros) | |||
| Earnings per share | A/C | 3.08 | 2.48 |
| | |||
| Diluted earnings per share | B/D | 3.05 | 2.46 |
Headline earnings per share (basic and diluted)
| (in millions of euros, except for share data) | June 30, 2024 | June 30, 2023 | |
| Net income used to calculate headline earnings per share(1) | |||
| Net income – Groupe share | 773 | 623 | |
| Items excluded: | |||
| 92 | 105 | |
| 34 | 83 | |
| (28) | (1) | |
| (14) | 3 | |
| Headline Groupe net income | E | 857 | 813 |
| Impact of dilutive instruments: | |||
| - Savings in financial expenses related to the conversion of debt instruments, net of tax | - | - | |
| Headline Groupe net income, diluted | F | 857 | 813 |
| Number of shares used to calculate earnings per share | |||
| Number of shares at January 1 | 254,311,860 | 254,311,860 | |
| Shares created over the period | - | - | |
| Treasury shares to be deducted (average for the period) | (3,600,220) | (3,482,522) | |
| Average number of shares used for the calculation | C | 250,711,640 | 250,829,338 |
| Impact of dilutive instruments: | |||
| - Free shares and dilutive stock options | 2,591,240 | 2,788,720 | |
| - Equity warrants (BSA) | - | - | |
| Number of diluted shares | D | 253,302,880 | 253,618,058 |
| (in euros) | |||
| Headline earnings per share(1) | E/C | 3.42 | 3.24 |
| Headline earnings per share – diluted(1) | F/D | 3.38 | 3.21 |
(1) EPS after elimination of impairment losses, amortization of intangibles from acquisitions, the main capital gains and losses on disposal and fair value adjustment of financial assets and revaluation of earn-out payments.
(2) As of June 30, 2024, the main capital gains and losses on disposal amount to euro 8 million and the fair value adjustment of financial assets amounts to euro 6 million. At June 30, 2023, the main capital gains and losses on disposal amount to euro 4 million and the fair value adjustment of financial assets amounts to euro (7) million.

![]()
