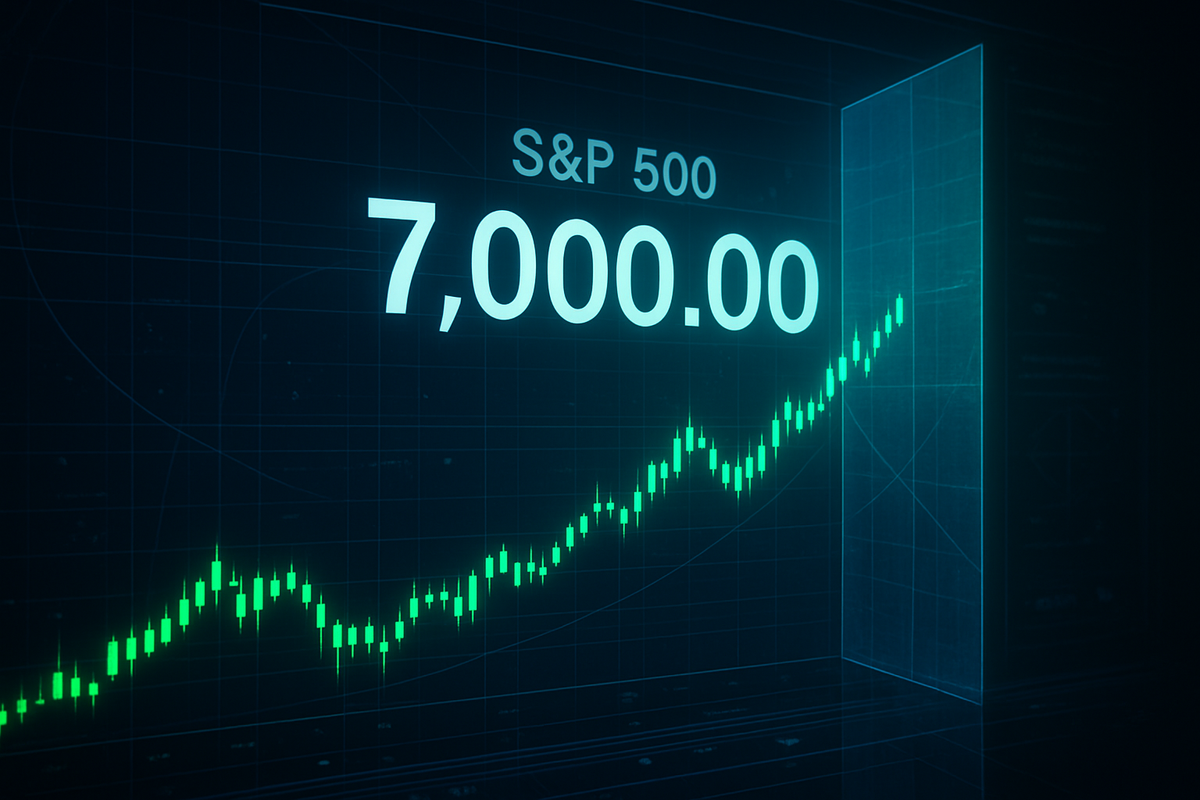
The financial world stood still on February 10, 2026, as the S&P 500 Index (INDEXSP: .INX) surged toward the historic 7,000 psychological barrier. After a relentless multi-year rally driven by the industrialization of artificial intelligence and a resilient "soft landing" for the U.S. economy, the index is now testing a critical resistance zone between 7,000 and 7,020. This level, dubbed the "Gamma Wall" by derivatives traders, represents a massive concentration of options positioning that could either serve as a ceiling for the market or a launchpad for a squeeze into uncharted territory.
For technical analysts and retail investors alike, the stakes have rarely been higher. As the index fluctuates near these record-breaking levels, market participants are laser-focused on whether the rally has the momentum to clear this hurdle or if the 7,000 mark will trigger a "sell the news" event. The immediate technical outlook remains bullish, but the narrow breadth of the market—dominated by a handful of technology giants—continues to raise questions about the sustainability of the current ascent.
The Ascent to Seven Thousand: A Technical Timeline
The path to 7,000 has been paved by a series of higher highs and higher lows that began in late 2024 and accelerated throughout 2025. Following a period of "normalization" in mid-2025, where the index consolidated around the 6,500 level, the S&P 500 caught a second wind in early 2026. This latest leg of the bull market was fueled by better-than-expected corporate earnings and a definitive signal from the Federal Reserve that interest rates have reached a stable, neutral plateau.
Technical traders are currently monitoring a specific resistance zone of 7,000 to 7,020. This range coincides with the 161.8% Fibonacci extension of the early-2025 correction, a level that often marks a pivot point for major market cycles. Leading up to today’s session, the index has seen a "melt-up" behavior, where short-sellers have been forced to cover positions, adding fuel to the fire. However, the volume profile suggests a degree of caution, with institutional buyers waiting for a sustained weekly close above 7,020 to confirm the next phase of the breakout.
Winners and Losers in the Record-Breaking Environment
The current environment has created a bifurcated market where the "Big Three"—Nvidia (NASDAQ: NVDA), Apple (NASDAQ: AAPL), and Microsoft (NASDAQ: MSFT)—now dictate approximately 24% of the index's total movement. Nvidia continues to be the primary winner, with its stock price hitting new all-time highs as the global demand for AI infrastructure remains insatiable. For Nvidia, a break above S&P 7,000 likely means a further expansion of its valuation multiples, potentially making it the most profitable company in history by the end of the year.
Conversely, traditional "defensive" sectors and small-cap stocks, often tracked via the Russell 2000 (INDEXRUSSELL: RUT), have struggled to keep pace. While the S&P 500 tests 7,000, many mid-cap companies are still trading well below their 2021 peaks, creating a "two-speed" market. Companies like Broadcom (NASDAQ: AVGO) and Meta Platforms (NASDAQ: META) have also emerged as significant winners, benefiting from the same AI-led capital expenditure cycle that has propelled the broader index. However, if the S&P fails to breach 7,020, these high-beta technology stocks are likely to lead the retreat, as they currently carry the highest "valuation risk" in the event of a correction.
Broad Market Significance and Historical Precedents
The attempt to breach 7,000 is not just a numerical milestone; it is a test of the market’s fundamental structural integrity. Historically, milestones of this magnitude—such as the 2,000 mark in the late 90s or the 5,000 mark in early 2024—have often been followed by periods of high volatility. Critics argue that the current market concentration, where the top 10 stocks control over 40% of the index, mirrors the Dot-com bubble of 2000. However, proponents of the rally point to the robust earnings and cash flows of today’s tech leaders as a key differentiator from the speculative fervor of the past.
The significance of the 7,000 level also lies in its role as a "psychological anchor." For many retail investors, 7,000 represents a level of "maximum optimism," which can often be a contrarian indicator. If the S&P 500 can hold above the 7,000-7,020 zone, it would validate the "super-cycle" thesis proposed by some of Wall Street’s most aggressive bulls. Conversely, a failure here could invite a significant "mean reversion" trade, as technical indicators like the Relative Strength Index (RSI) show the market is currently in deeply overbought territory on multiple timeframes.
The Road Ahead: Fibonacci Targets and Support Zones
Looking forward, the immediate upside targets for technical traders are the Fibonacci extension levels of 7,080 to 7,119. A successful breakout and "backtest" of the 7,000 level would likely see the index move rapidly toward this 7,100 range as momentum algorithms flip from "sell" to "buy." Beyond that, highly bullish Elliott Wave counts suggest a longer-term "measured move" target of 7,490 could be in play by the end of 2026, provided the macroeconomic environment remains stable.
On the downside, the key support levels that traders are watching are 6,945 to 6,975. This zone served as a brief consolidation area during last week's trade and must hold to maintain the current bullish structure. A break below 6,945 would likely trigger a deeper retracement toward the 6,800 "line in the sand," which analysts identify as the ultimate pivot between a bull and bear phase. Investors should prepare for a period of heightened intraday volatility as the market attempts to digest these historic levels.
Summary of the Market Outlook
The S&P 500’s test of the 7,000-7,020 resistance zone on February 10, 2026, marks a watershed moment for modern finance. While the index is buoyed by unprecedented technological advancement and a solid economic backdrop, the extreme concentration in a few mega-cap names remains a systemic risk. The coming days will determine if the "Gamma Wall" at 7,000 will be smashed or if it will force a long-overdue cooling period for the overextended market.
Moving forward, investors should keep a close eye on the 6,945 support level and the 7,119 Fibonacci extension target. The ability of the market to broaden its participation beyond the "Magnificent Seven" will also be a crucial factor in the sustainability of the rally. Whether this is the beginning of a new 8,000-point era or a temporary peak, the events of February 2026 will undoubtedly be studied by market historians for years to come.
This content is intended for informational purposes only and is not financial advice