
The precious metals market has just endured its most violent two-week stretch in modern financial history, as a parabolic rally met the immovable object of institutional deleveraging. In a stunning reversal that analysts are calling the "Great Metal Reset," Gold and Silver plummeted from historic highs in late January and early February 2026, wiping out trillions in paper wealth in a matter of sessions. The rout was punctuated by a "Black Wednesday" event where Silver plunged an unprecedented 30% in a single day, while Gold suffered a 12% haircut, its worst single-session decline since the 1980s.
The fallout from this volatility has sent shockwaves through global brokerage houses and mining boardrooms alike. What began as a strategic rotation into "hard assets" amid geopolitical tensions quickly devolved into a forced liquidation event as the CME Group (NASDAQ: CME) implemented aggressive margin hikes. However, as the dust settles on February 11, 2026, the market is showing signs of a "dead cat bounce" or perhaps a genuine stabilization. With Gold currently consolidating in the $4,500 to $4,800 range, a growing contingent of contrarian analysts is already suggesting that this "rout" was merely the necessary cooling period before a run toward $6,000 by mid-year.
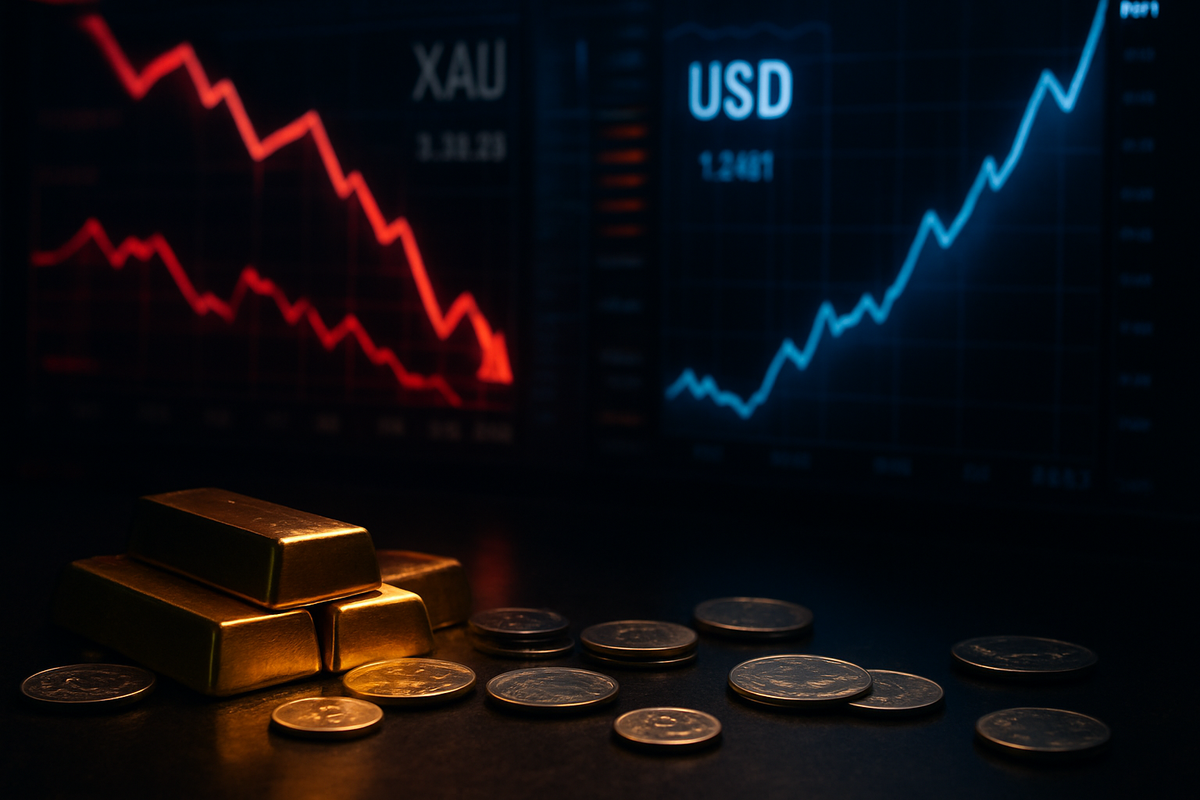
The seeds of the late-January collapse were sown during a frantic three-month melt-up where Silver breached $100 an ounce and Gold eclipsed $5,000. By the third week of January 2026, the market had become dangerously "one-way," with retail participation hitting levels not seen since the 2021 "Silver Squeeze." The catalyst for the reversal was twofold: a hawkish pivot by the Federal Reserve, dubbed the "Warsh Shock," which propelled the U.S. Dollar to multi-year highs, and a sudden, massive increase in margin requirements by the COMEX.
On January 28, 2026, the exchange transitioned to a more aggressive percentage-based margin system, effectively requiring traders to post significantly more collateral as prices climbed. As the U.S. Dollar Index (DXY) spiked on news of higher-for-longer interest rates, leveraged long positions were caught in a vice. The initial selling triggered automated "stop-loss" orders, which then led to a "margin call" cascade. By the morning of February 2, the selling became indiscriminate; institutional funds were forced to dump their most liquid winners—Gold and Silver—to cover losses in other crashing asset classes.
The scale of the "record rout" was breathtaking. At the peak of the panic, the bid-ask spreads for physical silver widened to levels that made digital trading virtually impossible for several hours. High-frequency trading algorithms exacerbated the slide, hunting for liquidity in a market that had suddenly gone dry. By the time the closing bell rang on the first Monday of February, the "Super-Rally" of 2025 had been effectively erased, leaving investors to grapple with the reality that even the ultimate safe havens are not immune to the mechanics of a liquidity squeeze.
For the major producers, the volatility has been a double-edged sword. Newmont (NYSE: NEM), the world’s largest gold miner, saw its shares dive nearly 20% during the peak of the sell-off despite record-breaking quarterly earnings reported just weeks prior. The company’s "Project Catalyst," an initiative aimed at reducing "All-In Sustaining Costs" (AISC) through autonomous mining technology, has provided a fundamental floor for the stock, but even Newmont's massive balance sheet could not shield it from the sector-wide de-risking. Similarly, Barrick Gold (NYSE: GOLD) faced significant pressure, though CEO Mark Bristow’s recent strategy to spin off non-core North American assets has been credited with helping the company maintain a slightly better liquidity profile than its peers during the crash.
The silver miners took the hardest hit, reflecting the 30% plunge in the underlying metal. Pan American Silver (NASDAQ: PAAS) experienced a historic intraday drop as investors fled "pure-play" silver exposure. However, PAAS has recently found support near its 200-day moving average, as dip-buyers bet on the company’s massive silver-equivalent reserves. On the other hand, the "royalty and streaming" companies like Franco-Nevada (NYSE: FNV) and Wheaton Precious Metals (NYSE: WPM) have emerged as the relative winners of this volatility. Because these firms do not operate mines directly and hold fixed-cost contracts, their margins remained protected even as the spot prices cratered, making them a preferred "safety" play for institutional managers during the stabilization phase.
Retail-oriented platforms and bullion dealers are also facing a complex landscape. While paper prices crashed, the demand for physical coins and bars has remained insatiable, leading to a record "decoupling" between the COMEX price and the street price. Companies specialized in vaulting and physical delivery have seen a surge in business, while brokerage firms that provided high leverage to retail traders are now dealing with the aftermath of massive account liquidations and potential regulatory scrutiny over "margin stress" transparency.
This event is far more than a simple market correction; it represents a fundamental shift in how precious metals interact with the modern financial plumbing. Historically, events like the 2011 Silver crash were driven by fixed-dollar margin hikes. In 2026, the move to percentage-based margins has introduced a "volatility tax" that automatically punishes parabolic moves. This suggests that the "wild west" days of precious metal rallies may be replaced by more controlled, albeit still volatile, upward trajectories. It also highlights the continued dominance of the U.S. Dollar as the "apex predator" of the financial markets; when the DXY moves with the velocity seen during the "Warsh Shock," no other asset class is safe.
The ripple effects are being felt across the commodities complex. Copper and Platinum have followed the downward trend of their more glamorous cousins, sparking concerns about a broader industrial slowdown. Furthermore, the "rout" has reignited debates in Washington and Brussels regarding the regulation of commodity futures. There is increasing talk among policymakers of implementing "circuit breakers" specifically designed for precious metals to prevent the 30% single-day wipeouts that can destabilize the broader financial system.
Comparisons to the 1980 "Silver Thursday" are inevitable, though the current scenario lacks a singular "villain" like the Hunt Brothers. Instead, the "villain" of 2026 appears to be the sheer volume of algorithmic leverage. This suggests a historical precedent where a sharp, violent flush-out is often followed by a more sustainable, "climb the wall of worry" rally. For central banks, who have been record buyers of gold over the last three years, this volatility may provide a strategic entry point to increase reserves at a "discount" relative to the January peaks.
As we look toward the remainder of 2026, the primary question is whether the "dip-buying" currently seen at the $4,500 gold level will hold. The short-term outlook remains murky as the market digests the "margin hangover." We expect to see a period of "base-building" where Gold oscillates between $4,500 and $4,800. If the Federal Reserve begins to soften its hawkish stance in response to the market turmoil, the "Warsh Shock" could quickly transition into a "Warsh Pivot," providing the fuel for a massive recovery.
Long-term, many analysts remain undeterred by the February rout. The fundamental drivers—rising global debt, currency devaluation, and geopolitical instability—have not changed. In fact, many major investment banks have reaffirmed their $6,000 price target for Gold by mid-2026, viewing the recent 12% drop as a "gift" for long-term allocators. The challenge for investors will be navigating the increased "carry cost" of holding leveraged positions in an environment where exchanges are quick to pull the margin trigger.
Strategic adaptations are already underway. We are seeing a shift away from high-leverage futures and toward physical ETFs and "zero-debt" mining companies. The market is maturing, and the volatility of early 2026 may be remembered as the "growing pains" of Gold and Silver as they transition from speculative commodities to a more permanent, high-value tier of the global monetary system.
The "record rally turned record rout" of 2026 will be studied by market historians for decades. It served as a stark reminder that even the most "certain" bull markets can be derailed by the technicalities of margin and the brute force of the U.S. Dollar. The key takeaway for investors is the importance of distinguishing between a "price crash" and a "fundamental collapse." While the prices on the screens turned red, the underlying demand for precious metals as a hedge against systemic risk remains as high as ever.
Moving forward, the market is likely to be characterized by "calculated caution." Investors should keep a close eye on the $4,400 support level for Gold and the $70 level for Silver; a breach below these could signal a longer "winter" for the sector. However, if the current stabilization holds, the path to $6,000 remains open. The coming months will be a test of resolve for the "gold bugs" and a potential opportunity for those who had the patience to wait for the inevitable "reset."
The volatility of 2026 has proved that in the world of precious metals, the "safe haven" is never truly safe from the mechanics of the market itself. Investors must remain vigilant, prioritize liquidity, and remember that in a world of paper promises, the physical asset eventually finds its floor.
This content is intended for informational purposes only and is not financial advice.


