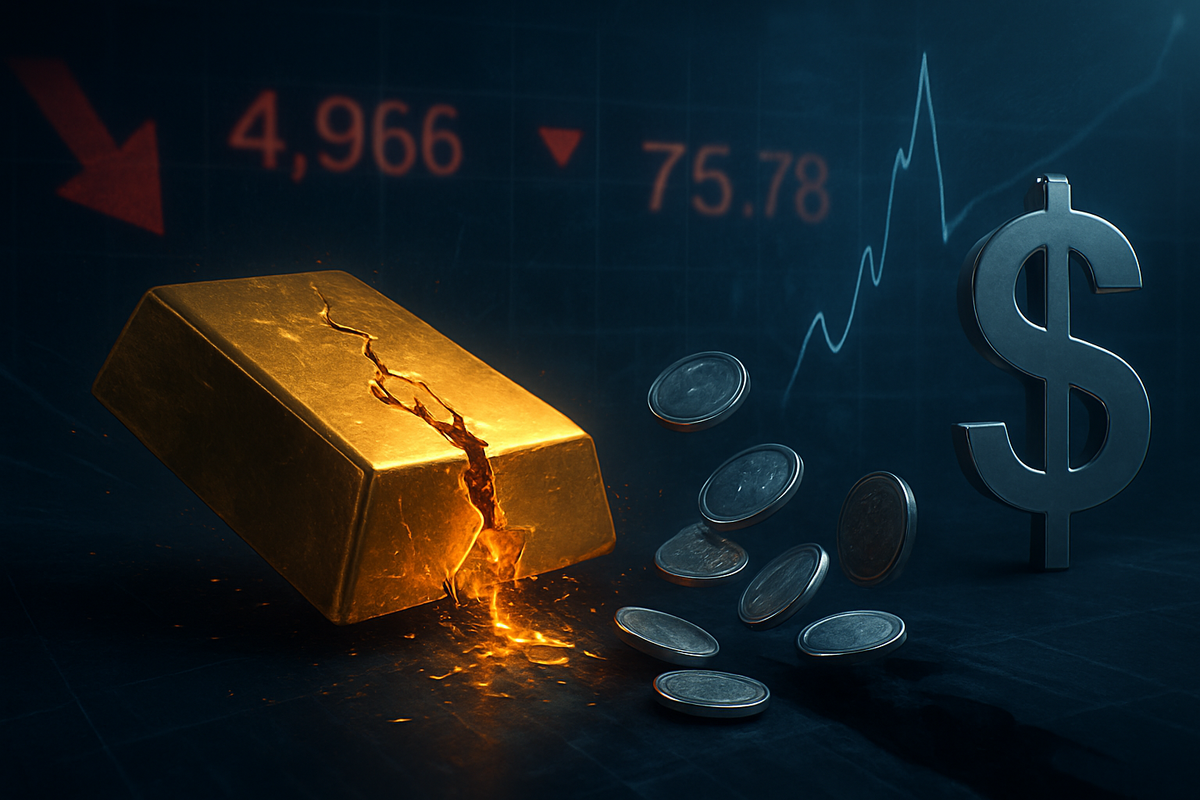
The precious metals market suffered a historic "liquidity flush" yesterday, February 12, 2026, as a surprisingly strong U.S. labor report sent shockwaves through global commodities. Gold prices tumbled 2.59%, closing at $4,966 per ounce and decisively breaching the psychologically critical $5,000 support level. The carnage was even more pronounced in the silver market, where prices cratered by nearly 10% to settle at $75.78 per ounce, erasing months of speculative gains in a single afternoon.
This sudden reversal marks a stark departure from the bullish momentum that had defined the start of 2026. As investors digest the implications of a resilient U.S. economy, the "higher-for-longer" interest rate narrative has returned with a vengeance, strengthening the U.S. Dollar and forcing a mass exodus from non-yielding assets. The fallout has left traders questioning whether this is a temporary correction or the end of the historic bull run for "safe-haven" assets.
A Technical Breach and the 'Liquidity Flush'
The catalyst for the sell-off was the release of January’s non-farm payroll data, which revealed a massive 130,000 jump in employment—nearly double the consensus forecast of 70,000. Simultaneously, the U.S. unemployment rate dipped to 4.3%, defying expectations of a steady or rising figure. This robust economic snapshot effectively neutralized the urgency for the Federal Reserve to implement the interest rate cuts that markets had aggressively priced in for March. As Treasury yields climbed, the opportunity cost of holding gold soared, triggering a wave of institutional selling.
The decline accelerated into a "liquidity flush" once gold fell through the $5,000 mark. Analysts noted that a dense cluster of stop-loss orders and automated sell programs were triggered at this level, creating a cascading effect. As prices dropped, leveraged traders were hit with margin calls, forcing them to liquidate positions regardless of price to cover their obligations. This mechanical selling saw gold reach intraday lows near $4,878 before a minor recovery toward the close, while silver experienced extreme volatility that saw the iShares Silver Trust (NYSE Arca: SLV) trade volumes exceed those of many mega-cap technology stocks.
Winners and Losers in the Commodities Crater
The primary casualties of yesterday’s route were the major exchange-traded funds and mining conglomerates. The SPDR Gold Shares (NYSE Arca: GLD) fell 3.47%, reflecting the broader retreat in spot prices. Even more battered was the silver sector; the iShares Silver Trust (NYSE Arca: SLV) saw a staggering double-digit percentage decline as retail sentiment soured. Major mining companies also felt the heat, with industry giants like Newmont Corporation (NYSE: NEM) and Barrick Gold Corporation (NYSE: GOLD) seeing their share prices slide as investors recalculated the future profitability of their reserves at lower price points. Silver-focused miners like Pan American Silver Corp. (NASDAQ: PAAS) were hit particularly hard, given the industrial metal's 10% plunge.
On the winning side of the ledger, the U.S. Dollar emerged as the clear victor. The U.S. Dollar Index (DXY) moved higher, reinforcing its status as the world’s premier safe haven when economic data suggests American exceptionalism remains intact. Short-sellers and hedge funds that had pivoted to a "hawkish" Fed stance also saw significant gains. Furthermore, financial institutions that benefit from a steeper yield curve found some relief, as the strong labor data suggests the Fed may keep rates at restrictive levels for several more months, boosting net interest margins for major banks.
Shifting Trends and Historical Precedents
The February 12 plunge fits into a broader trend of market volatility driven by "data dependency." For much of late 2025, the market operated on the assumption that a cooling economy would force the Fed's hand. Yesterday’s data shattered that consensus, illustrating the difficulty of timing the "pivot." Historically, gold has often experienced these types of "bull trap" corrections after reaching major round-number milestones; the breach of $5,000 echoes the volatility seen when gold first crossed $1,000 in 2008 and $2,000 in 2020. In both prior cases, the initial breach was followed by a sharp retrenchment before a more sustainable base was formed.
The broader significance of this event lies in the regulatory and policy implications. Central banks, particularly in BRICS nations, have been heavy accumulators of gold over the past year. This price drop may offer these sovereign buyers a more attractive entry point, potentially putting a floor under the market in the coming weeks. However, if the U.S. labor market remains this tight, the Fed may be forced to maintain its restrictive stance well into the summer, which could fundamentally alter the "de-dollarization" trade that has propped up gold prices recently.
The Road Ahead: Support or Further Slide?
In the short term, the primary question for investors is whether the $5,000 level will transition from a firm support floor to a formidable ceiling of resistance. Market participants will be looking closely at the $4,800 to $4,900 range as the next potential support zone. Strategic pivots are already underway, with some institutional desks moving toward a "neutral" weighting on precious metals while they wait for more clarity on inflation data. If upcoming CPI reports remain sticky, the pressure on gold and silver could persist as the market reconciles with a Fed that is in no rush to ease.
Looking further out, the fundamental drivers for gold—high global debt levels and geopolitical uncertainty—have not disappeared. However, the "speculative froth" has been decisively blown off the top of the market. This reset may actually lead to a healthier long-term trend, as it flushes out weak-handed retail leverage and allows longer-term value investors to re-enter. The potential for a "soft landing" in the U.S. remains the biggest threat to gold's upside; if the economy continues to add jobs without reigniting inflation, the need for a gold "insurance policy" diminishes significantly.
Final Assessment for the Road to March
Yesterday’s $5,000 breach and the subsequent collapse in silver prices serve as a stark reminder of the risks inherent in "crowded" trades. While the 130,000 payroll jump was the immediate trigger, the underlying cause was a market that had become overly complacent in its expectations for rate cuts. Moving forward, the relationship between the U.S. Dollar and precious metals will be the primary metric to watch. If the dollar continues to gain strength on the back of American economic resilience, gold may struggle to regain its footing above the $5,000 mark.
For investors, the coming months will require a high degree of selectivity. The "everything rally" in metals has hit a significant roadblock, and the divergence between gold and silver performance suggests that industrial demand and monetary demand are decoupling. Watch for the next Federal Open Market Committee (FOMC) meeting and subsequent "dot plot" updates, as any hint of a prolonged pause will likely keep the pressure on GLD and SLV. For now, the "liquidity flush" of February 12 has redefined the trading range for 2026.
This content is intended for informational purposes only and is not financial advice.