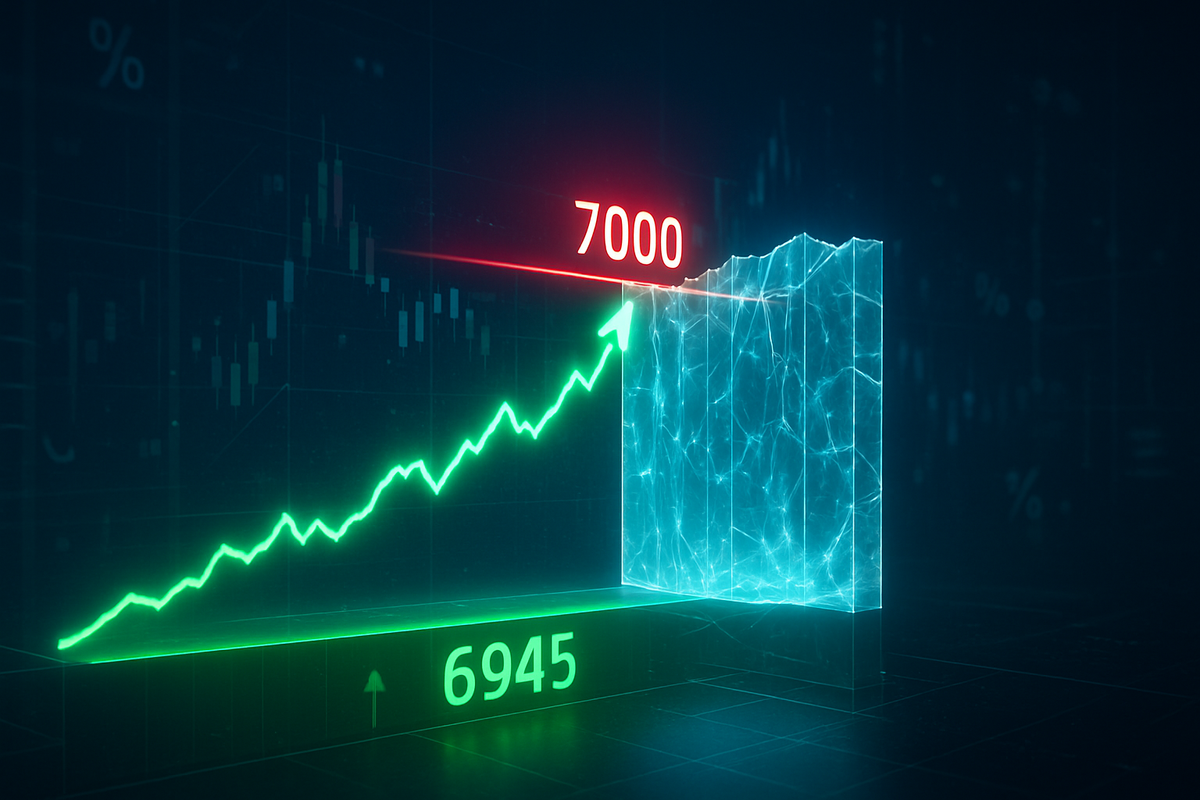
As of February 13, 2026, the equity markets find themselves at a historic crossroads. The S&P 500 Index (NYSEARCA: SPY) is currently locked in a high-stakes technical battle with the 7,000 psychological handle—a level that has proven to be a formidable "Gamma Wall" for institutional and retail traders alike. After a blistering rally throughout 2025 and early 2026, the index briefly pierced the 7,000 mark in late January, only to be met with a wave of mechanical selling that has since pinned the market in a tight, volatile range.
The immediate implications are significant: a decisive breakout above 7,000 could trigger a "gamma squeeze," propelling the market toward 7,200 in a matter of days. Conversely, a failure to hold the current technical floor at 6,945—a level widely cited by analysts as the "line in the sand"—could signal the end of the current AI-driven leg of the bull market, potentially inviting a deeper 5-10% correction as market makers unwind their hedges.
The Mechanics of Resistance: Why 7,000 is the Ultimate Ceiling
The struggle at 7,000 is not merely psychological; it is deeply structural. Options market data indicates a massive concentration of open interest at the 7,000 strike price, creating what is known in the industry as a "Gamma Wall." For market makers who have sold these call options, the rising price of the S&P 500 requires them to sell index futures to maintain a delta-neutral position. This mechanical selling creates a "sticky" resistance that makes it incredibly difficult for the index to sustain momentum above the strike price.
This timeline of the current standoff began on January 28, 2026, when the index hit an all-time intraday high of 7,002.28. The breakthrough was short-lived, as the heavy concentration of short gamma forced dealers to aggressively sell into the strength. Since then, the market has undergone a period of "gamma pinning," where price action is dampened and volatility is compressed as the index gravitates toward the strike with the highest open interest. Major institutional players, including Goldman Sachs and JPMorgan, have noted that until this wall is cleared—likely requiring a close above 7,020—the market remains vulnerable to "exhaustion risk."
Titans of the Index: The Winners and Losers of the 7,000 Battle
The fate of the 7,000 level rests largely on the shoulders of the "Magnificent Seven," who collectively command nearly 30% of the index's weight. NVIDIA Corporation (NASDAQ: NVDA) remains the primary driver; having reached a $5 trillion market cap late last year, its upcoming earnings report on February 25 is seen as the ultimate catalyst. If NVIDIA provides another "beat-and-raise" cycle, it could provide the fundamental force necessary to shatter the Gamma Wall. Conversely, any sign of slowing demand for AI infrastructure could see NVIDIA lead the index back toward the 6,500 range.
Meanwhile, Microsoft Corporation (NASDAQ: MSFT) and Apple Inc. (NASDAQ: AAPL) have provided mixed signals. While Microsoft's $281 billion AI contract backlog initially fueled the push to 7,000, Amazon.com Inc. (NASDAQ: AMZN) recently spooked the market with a projected $200 billion capital expenditure plan for 2026. This "capex shock" has created a rotation where investors are moving away from high-spending tech names and into defensive sectors. Alphabet Inc. (NASDAQ: GOOGL) has also faced pressure, as its massive infrastructure spend weighs on margins, despite record-breaking revenues. For these companies, a rejection at 7,000 could mean a prolonged period of consolidation as the market demands more "efficiency" over "growth at any cost."
Beyond the Numbers: The Broader Market Significance
The current technical battle is a reflection of a broader industry trend: the transition from speculative AI excitement to the "industrialization" of artificial intelligence. In 2024 and 2025, the market rose on the promise of what AI could do; in 2026, the market is judging companies on what they are actually spending and earning from the technology. The struggle at 7,000 mirrors the historical precedents seen when the S&P 500 battled the 2,000 level in 2014 and the 5,000 level in 2024—each representing a "watershed moment" where the market had to digest significant gains before the next leg higher.
Furthermore, there are regulatory and policy implications at play. As the index flirts with 7,000, the Federal Reserve remains in a delicate balancing act. Strong labor data and sticky service inflation have prevented the central bank from cutting rates as aggressively as the market had hoped in late 2025. This "higher-for-longer" reality, combined with the extreme valuations found at 7,000, has created a scenario where the margin for error is razor-thin. If the 6,945 support level fails, it may not just be a technical breakdown, but a signal that the market's "AI-exceptionalism" is finally being repriced against a backdrop of restrictive monetary policy.
The Road Ahead: Potential Scenarios for the Spring of 2026
In the short term, all eyes are on the 6,945 support level. Should the S&P 500 hold this floor, a period of "sideways-to-up" consolidation is the most likely outcome, allowing the Gamma Wall to slowly decay as options approach expiration. This would set the stage for a "melt-up" in March, potentially taking the index toward the 7,150-7,200 range. Traders are watching for a "squeeze" where market makers are forced to buy back the futures they sold, accelerating the move higher once the 7,000 strike is decisively cleared.
However, a strategic pivot may be required if 6,945 is breached on heavy volume. Such a move would likely trigger a cascade of stop-loss orders and a "de-risking" event among quant funds and trend-followers. In this scenario, the market could quickly find itself testing the 6,800 level, or even the 200-day moving average near 6,650. This would represent a healthy, albeit painful, correction that would flush out the "weak hands" and reset valuations for a potential year-end rally toward 7,500.
Investor Wrap-Up: What to Watch in the Coming Months
The battle for 7,000 is the defining market story of early 2026. It represents the intersection of technical market mechanics, massive psychological barriers, and the fundamental realities of the AI revolution. The key takeaway for investors is that the 6,945 level is the critical pivot point; as long as the index remains above this mark, the structural integrity of the bull market remains intact. However, the presence of the Gamma Wall at 7,000 suggests that gains from here will be hard-earned and characterized by heightened volatility.
Moving forward, the primary focus must remain on the upcoming earnings from NVIDIA and the updated capital expenditure guidance from the rest of the mega-cap tech sector. Investors should also keep a close watch on "Vanna" and "Charm" flows—secondary options Greeks that often pull the market toward high-concentration strikes as expiration dates approach. Whether 7,000 becomes the new floor or remains a formidable ceiling will depend on the market's ability to translate AI spending into bottom-line growth. For now, the siege continues, and the 6,945 level remains the most important number on every trader's screen.
This content is intended for informational purposes only and is not financial advice.