Aerospace and defense company Textron (NYSE: TXT) fell short of the market’s revenue expectations in Q3 CY2025, but sales rose 5.1% year on year to $3.60 billion. Its non-GAAP profit of $1.55 per share was 6.4% above analysts’ consensus estimates.
Is now the time to buy Textron? Find out by accessing our full research report, it’s free for active Edge members.
Textron (TXT) Q3 CY2025 Highlights:
- Revenue: $3.60 billion vs analyst estimates of $3.67 billion (5.1% year-on-year growth, 1.9% miss)
- Adjusted EPS: $1.55 vs analyst estimates of $1.46 (6.4% beat)
- Adjusted EBITDA: $454 million vs analyst estimates of $446.5 million (12.6% margin, 1.7% beat)
- Management reiterated its full-year Adjusted EPS guidance of $6.10 at the midpoint
- Operating Margin: 9.9%, up from 7.6% in the same quarter last year
- Free Cash Flow Margin: 7.6%, up from 4.1% in the same quarter last year
- Market Capitalization: $14.72 billion
"Overall, third quarter revenue was up 5% for Textron with higher revenues at Aviation, Bell, and Textron Systems," said Textron Chairman and CEO Scott C. Donnelly.
Company Overview
Listed on the NYSE in 1947, Textron (NYSE: TXT) provides products and services in the aerospace, defense, industrial, and finance sectors.
Revenue Growth
Reviewing a company’s long-term sales performance reveals insights into its quality. Any business can have short-term success, but a top-tier one grows for years. Unfortunately, Textron’s 3.4% annualized revenue growth over the last five years was sluggish. This was below our standard for the industrials sector and is a rough starting point for our analysis.
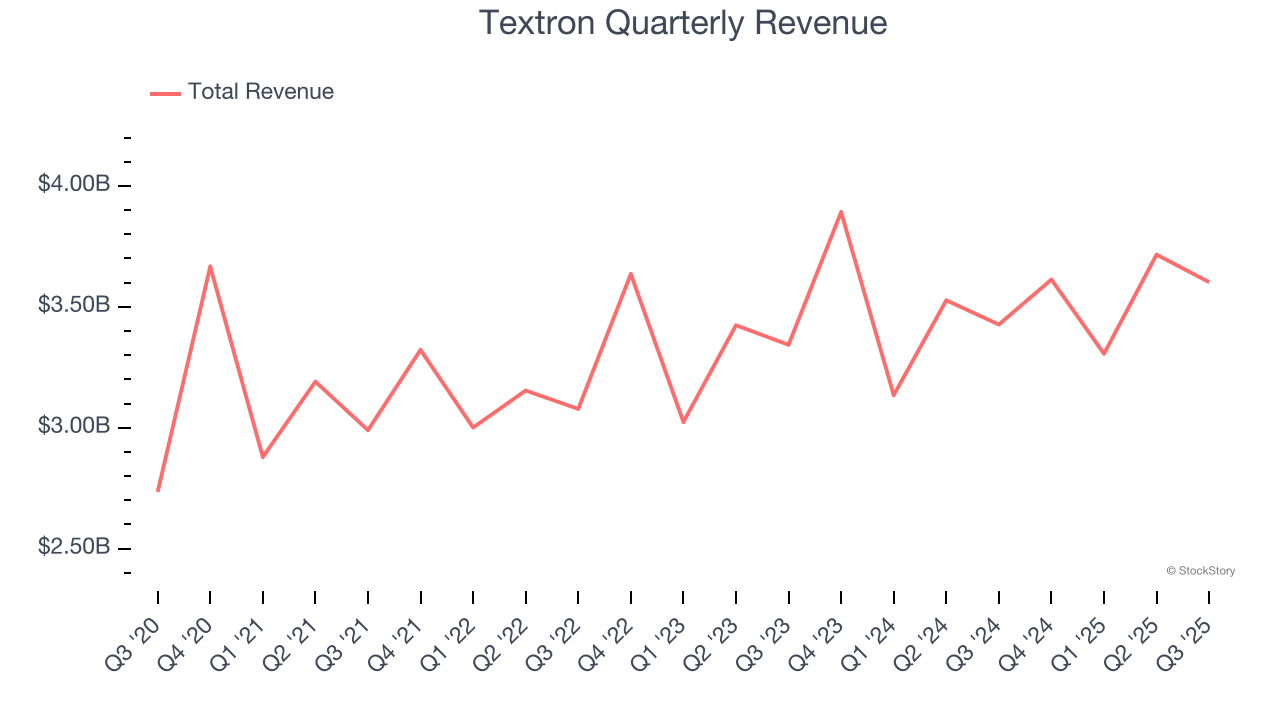
Long-term growth is the most important, but within industrials, a half-decade historical view may miss new industry trends or demand cycles. Textron’s annualized revenue growth of 3% over the last two years aligns with its five-year trend, suggesting its demand was consistently weak. 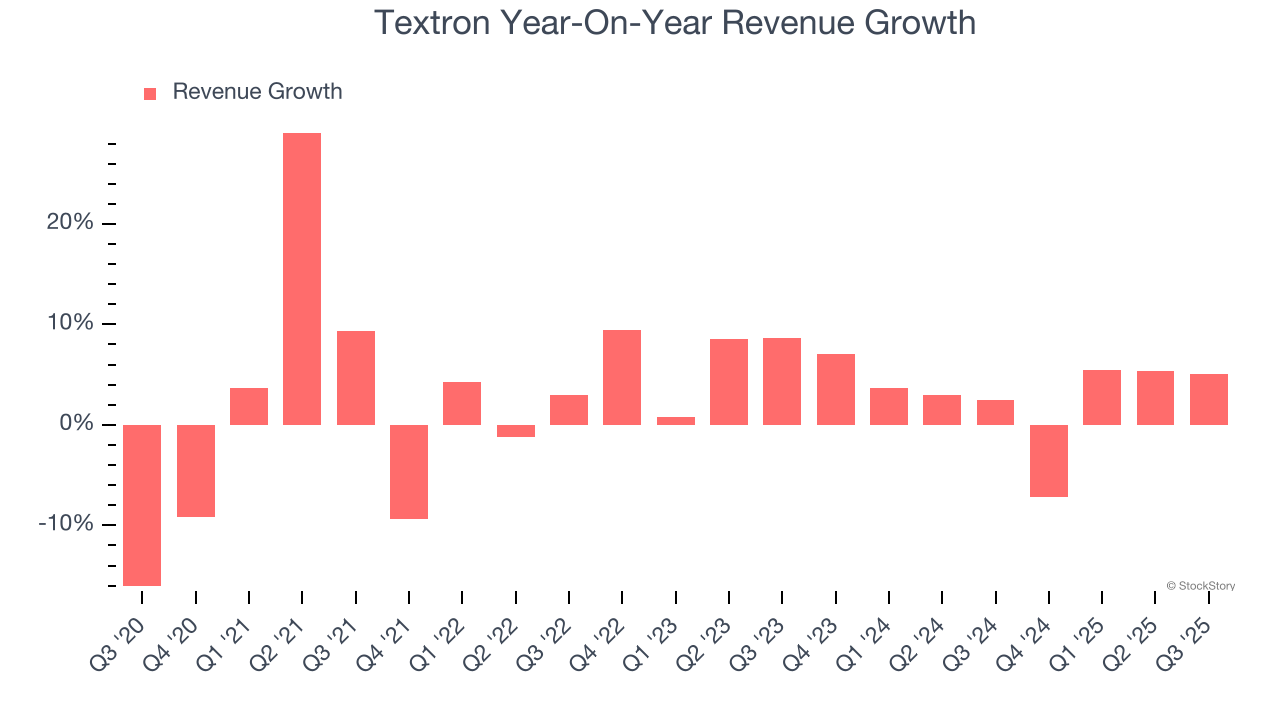
This quarter, Textron’s revenue grew by 5.1% year on year to $3.60 billion, missing Wall Street’s estimates.
Looking ahead, sell-side analysts expect revenue to grow 8.7% over the next 12 months, an improvement versus the last two years. This projection is above average for the sector and indicates its newer products and services will fuel better top-line performance.
Software is eating the world and there is virtually no industry left that has been untouched by it. That drives increasing demand for tools helping software developers do their jobs, whether it be monitoring critical cloud infrastructure, integrating audio and video functionality, or ensuring smooth content streaming. Click here to access a free report on our 3 favorite stocks to play this generational megatrend.
Operating Margin
Operating margin is an important measure of profitability as it shows the portion of revenue left after accounting for all core expenses – everything from the cost of goods sold to advertising and wages. It’s also useful for comparing profitability across companies with different levels of debt and tax rates because it excludes interest and taxes.
Textron’s operating margin might fluctuated slightly over the last 12 months but has remained more or less the same, averaging 8.4% over the last five years. This profitability was higher than the broader industrials sector, showing it did a decent job managing its expenses.
Analyzing the trend in its profitability, Textron’s operating margin might fluctuated slightly but has generally stayed the same over the last five years. This raises questions about the company’s expense base because its revenue growth should have given it leverage on its fixed costs, resulting in better economies of scale and profitability.
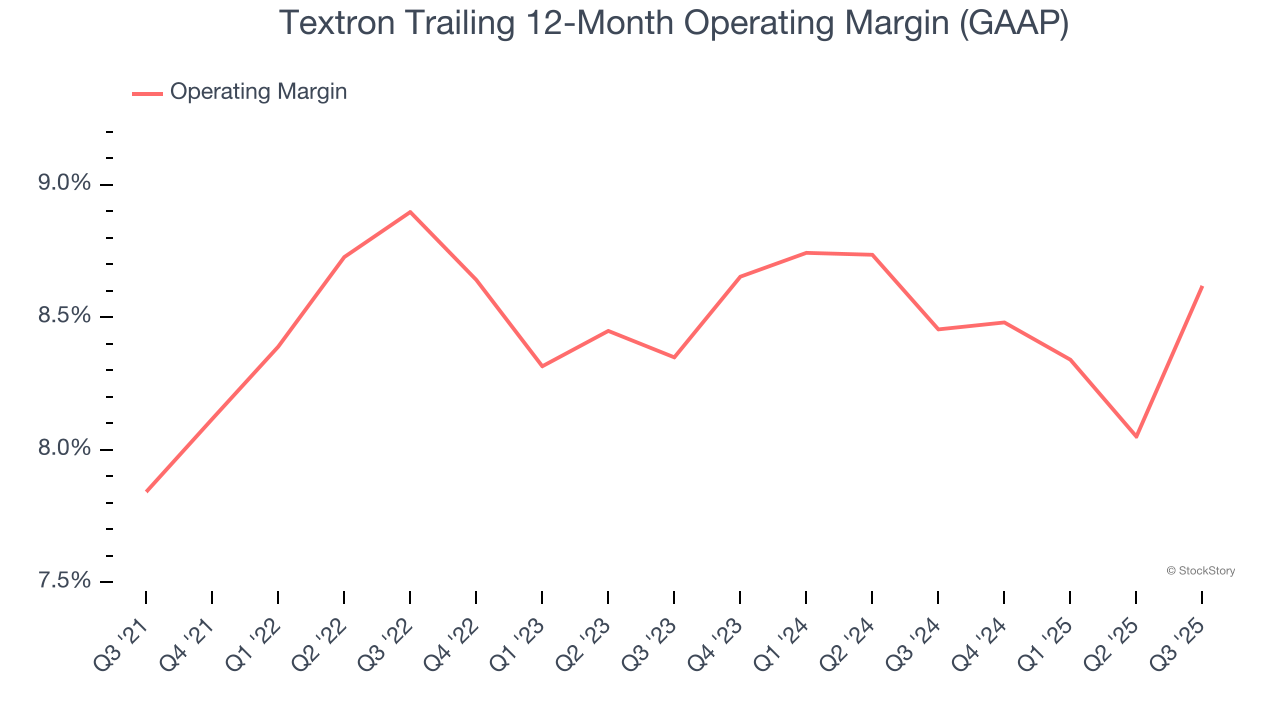
This quarter, Textron generated an operating margin profit margin of 9.9%, up 2.3 percentage points year on year. This increase was a welcome development and shows it was more efficient.
Earnings Per Share
We track the long-term change in earnings per share (EPS) for the same reason as long-term revenue growth. Compared to revenue, however, EPS highlights whether a company’s growth is profitable.
Textron’s EPS grew at an astounding 22% compounded annual growth rate over the last five years, higher than its 3.4% annualized revenue growth. This tells us the company became more profitable on a per-share basis as it expanded.
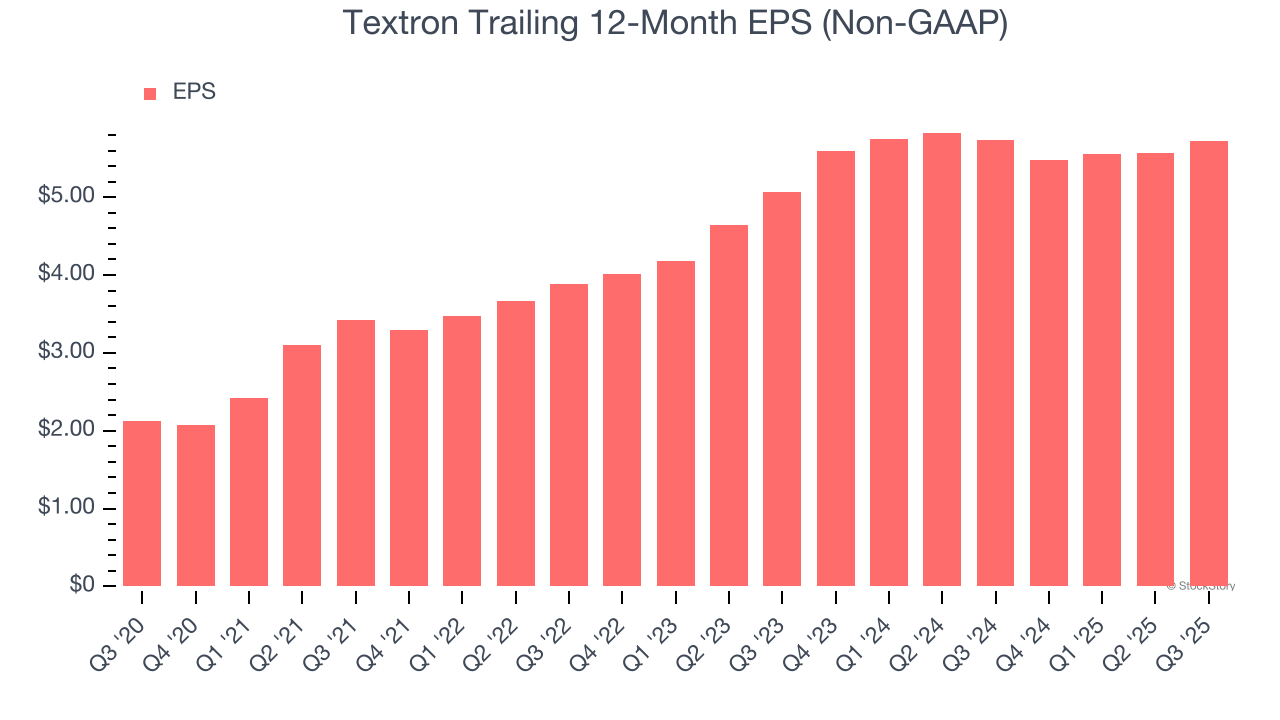
Diving into the nuances of Textron’s earnings can give us a better understanding of its performance. A five-year view shows that Textron has repurchased its stock, shrinking its share count by 21.9%. This tells us its EPS outperformed its revenue not because of increased operational efficiency but financial engineering, as buybacks boost per share earnings. 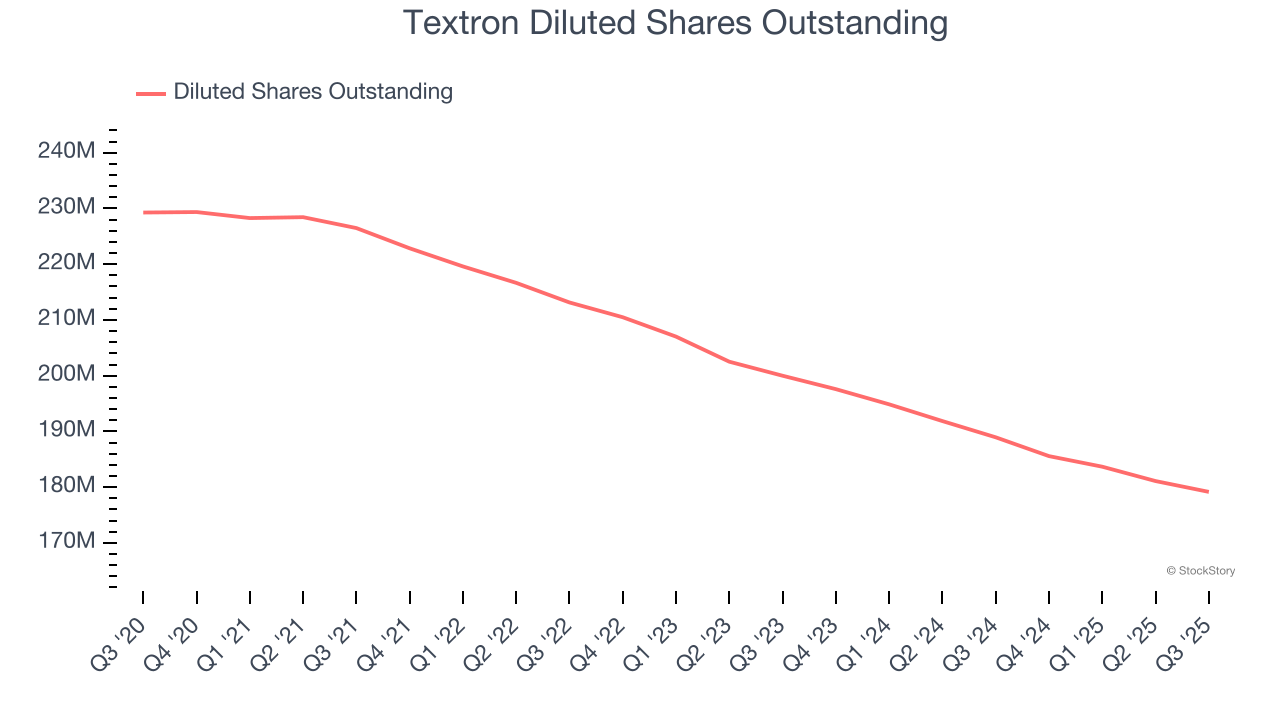
Like with revenue, we analyze EPS over a shorter period to see if we are missing a change in the business.
For Textron, its two-year annual EPS growth of 6.2% was lower than its five-year trend. We hope its growth can accelerate in the future.
In Q3, Textron reported adjusted EPS of $1.55, up from $1.40 in the same quarter last year. This print beat analysts’ estimates by 6.4%. Over the next 12 months, Wall Street expects Textron’s full-year EPS of $5.72 to grow 19.1%.
Key Takeaways from Textron’s Q3 Results
It was good to see Textron beat analysts’ EPS expectations this quarter. We were also happy its EBITDA outperformed Wall Street’s estimates. On the other hand, its revenue missed. Overall, this was a mixed quarter. The stock traded down 1.3% to $81.49 immediately following the results.
Textron underperformed this quarter, but does that create an opportunity to invest right now? The latest quarter does matter, but not nearly as much as longer-term fundamentals and valuation, when deciding if the stock is a buy. We cover that in our actionable full research report which you can read here, it’s free for active Edge members.