
Workplace furnishings manufacturer HNI Corporation (NYSE: HNI) missed Wall Street’s revenue expectations in Q3 CY2025 as sales only rose 1.7% year on year to $683.8 million. Its non-GAAP profit of $1.10 per share was 3% above analysts’ consensus estimates.
Is now the time to buy HNI? Find out by accessing our full research report, it’s free for active Edge members.
HNI (HNI) Q3 CY2025 Highlights:
- Revenue: $683.8 million vs analyst estimates of $691.5 million (1.7% year-on-year growth, 1.1% miss)
- Adjusted EPS: $1.10 vs analyst estimates of $1.07 (3% beat)
- Adjusted EBITDA: $92.7 million vs analyst estimates of $98.36 million (13.6% margin, 5.8% miss)
- Operating Margin: 9.4%, down from 10.5% in the same quarter last year
- Free Cash Flow Margin: 2.9%, down from 17% in the same quarter last year
- Market Capitalization: $2.06 billion
“Our third quarter performance demonstrates the strength of our strategies and our ability to manage through varying macroeconomic conditions and daily uncertainty, while remaining focused on investing for the future. We expect strong results to continue, driven by our margin expansion efforts and continued volume growth,” stated Jeff Lorenger, Chairman, President, and Chief Executive Officer.
Company Overview
With roots dating back to 1944 and a significant acquisition of Kimball International in 2023, HNI (NYSE: HNI) manufactures and sells office furniture systems, seating, and storage solutions, as well as residential fireplaces and heating products.
Revenue Growth
A company’s long-term sales performance is one signal of its overall quality. Even a bad business can shine for one or two quarters, but a top-tier one grows for years.
With $2.59 billion in revenue over the past 12 months, HNI is a mid-sized business services company, which sometimes brings disadvantages compared to larger competitors benefiting from better economies of scale. On the bright side, it can still flex high growth rates because it’s working from a smaller revenue base.
As you can see below, HNI grew its sales at a decent 5.2% compounded annual growth rate over the last five years. This shows its offerings generated slightly more demand than the average business services company, a useful starting point for our analysis.
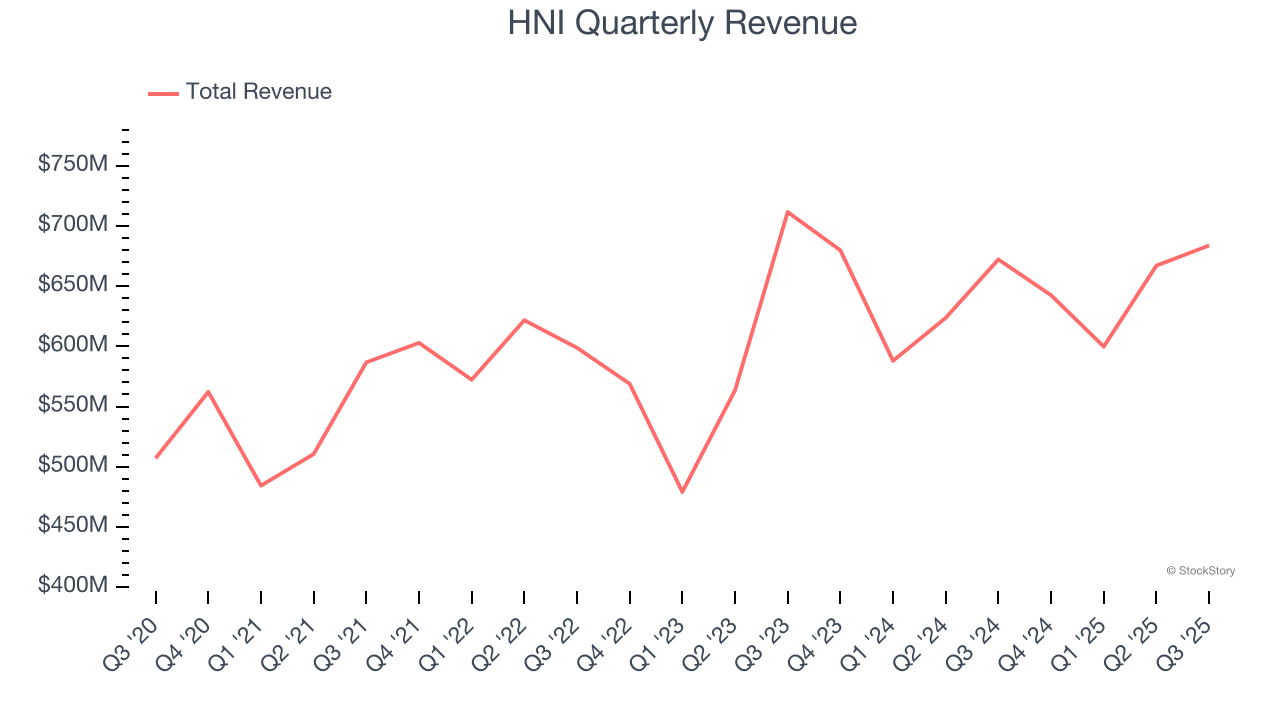
We at StockStory place the most emphasis on long-term growth, but within business services, a half-decade historical view may miss recent innovations or disruptive industry trends. HNI’s annualized revenue growth of 5.7% over the last two years aligns with its five-year trend, suggesting its demand was stable. 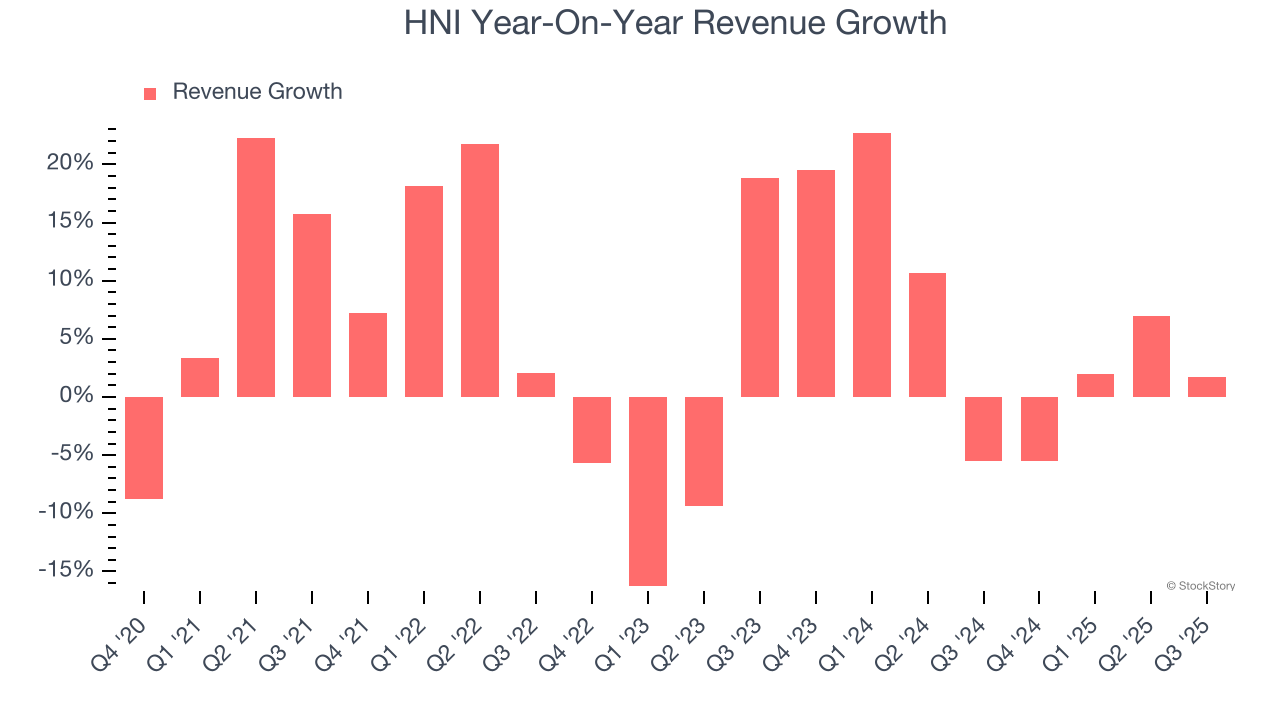
This quarter, HNI’s revenue grew by 1.7% year on year to $683.8 million, falling short of Wall Street’s estimates.
Looking ahead, sell-side analysts expect revenue to grow 5.7% over the next 12 months, similar to its two-year rate. This projection is above average for the sector and indicates its newer products and services will help maintain its recent top-line performance.
Software is eating the world and there is virtually no industry left that has been untouched by it. That drives increasing demand for tools helping software developers do their jobs, whether it be monitoring critical cloud infrastructure, integrating audio and video functionality, or ensuring smooth content streaming. Click here to access a free report on our 3 favorite stocks to play this generational megatrend.
Operating Margin
Operating margin is an important measure of profitability as it shows the portion of revenue left after accounting for all core expenses – everything from the cost of goods sold to advertising and wages. It’s also useful for comparing profitability across companies with different levels of debt and tax rates because it excludes interest and taxes.
HNI was profitable over the last five years but held back by its large cost base. Its average operating margin of 6.9% was weak for a business services business.
On the plus side, HNI’s operating margin rose by 3.5 percentage points over the last five years, as its sales growth gave it operating leverage.
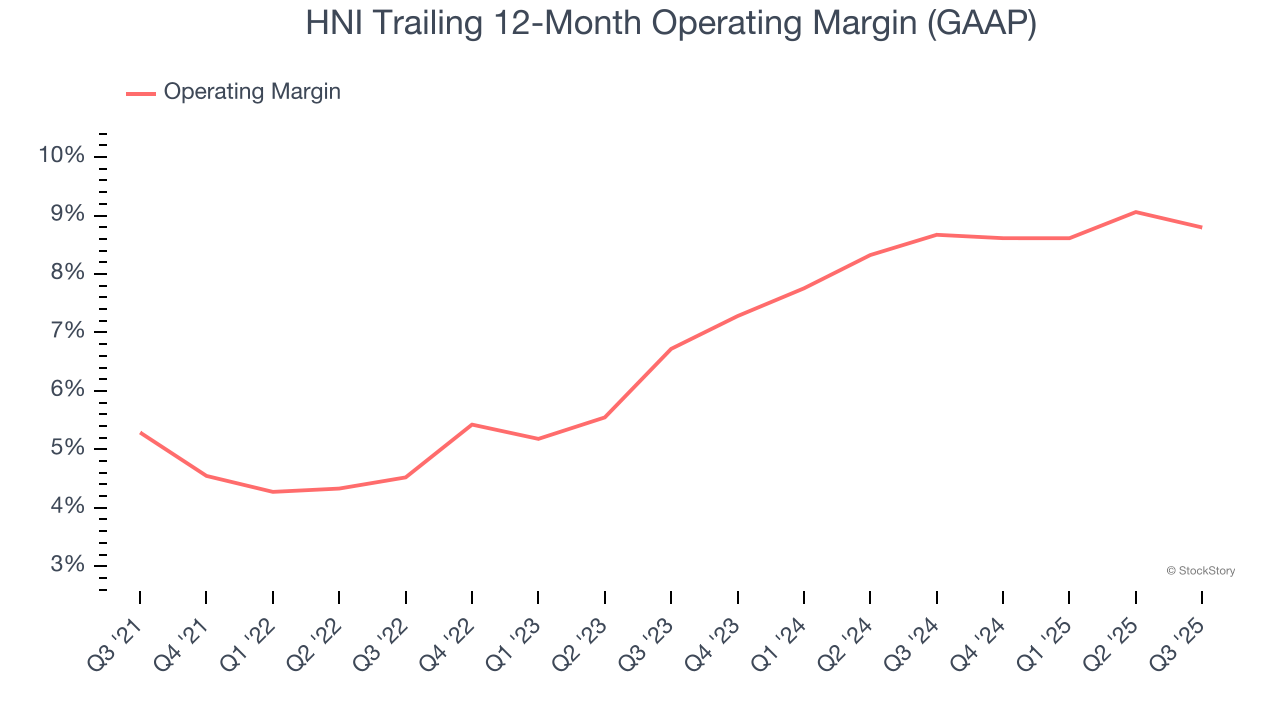
In Q3, HNI generated an operating margin profit margin of 9.4%, down 1 percentage points year on year. This reduction is quite minuscule and indicates the company’s overall cost structure has been relatively stable.
Earnings Per Share
Revenue trends explain a company’s historical growth, but the long-term change in earnings per share (EPS) points to the profitability of that growth – for example, a company could inflate its sales through excessive spending on advertising and promotions.
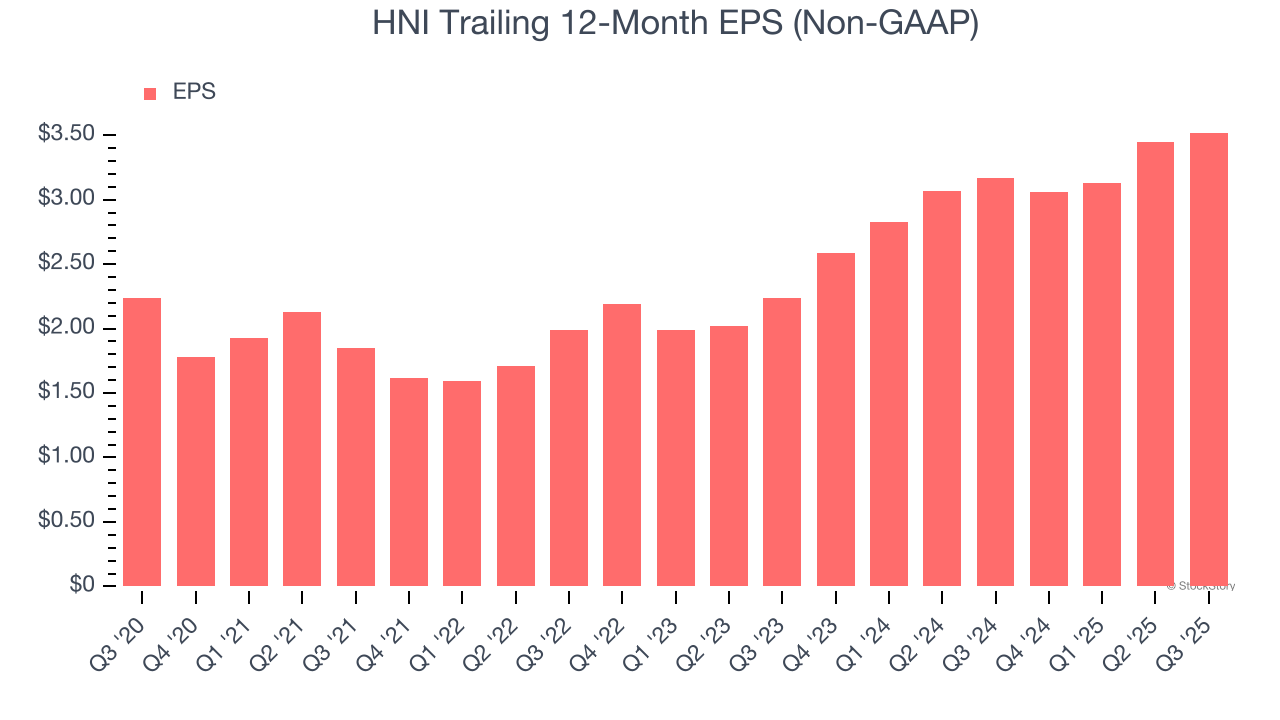
HNI’s EPS grew at a solid 9.5% compounded annual growth rate over the last five years, higher than its 5.2% annualized revenue growth. This tells us the company became more profitable on a per-share basis as it expanded.
We can take a deeper look into HNI’s earnings quality to better understand the drivers of its performance. As we mentioned earlier, HNI’s operating margin declined this quarter but expanded by 3.5 percentage points over the last five years. This was the most relevant factor (aside from the revenue impact) behind its higher earnings; interest expenses and taxes can also affect EPS but don’t tell us as much about a company’s fundamentals.
Like with revenue, we analyze EPS over a shorter period to see if we are missing a change in the business.
For HNI, its two-year annual EPS growth of 25.4% was higher than its five-year trend. We love it when earnings growth accelerates, especially when it accelerates off an already high base.
In Q3, HNI reported adjusted EPS of $1.10, up from $1.03 in the same quarter last year. This print beat analysts’ estimates by 3%. Over the next 12 months, Wall Street expects HNI’s full-year EPS of $3.52 to grow 11.8%.
Key Takeaways from HNI’s Q3 Results
It was good to see HNI beat analysts’ EPS expectations this quarter. On the other hand, its revenue slightly missed. Overall, this was a weaker quarter. The stock remained flat at $44.95 immediately after reporting.
So do we think HNI is an attractive buy at the current price? The latest quarter does matter, but not nearly as much as longer-term fundamentals and valuation, when deciding if the stock is a buy. We cover that in our actionable full research report which you can read here, it’s free for active Edge members.