Diversified industrial manufacturing company Worthington (NYSE: WOR) reported Q4 CY2025 results topping the market’s revenue expectations, with sales up 19.5% year on year to $327.5 million. Its non-GAAP profit of $0.65 per share was 7.7% below analysts’ consensus estimates.
Is now the time to buy Worthington? Find out by accessing our full research report, it’s free for active Edge members.
Worthington (WOR) Q4 CY2025 Highlights:
- Revenue: $327.5 million vs analyst estimates of $310.6 million (19.5% year-on-year growth, 5.4% beat)
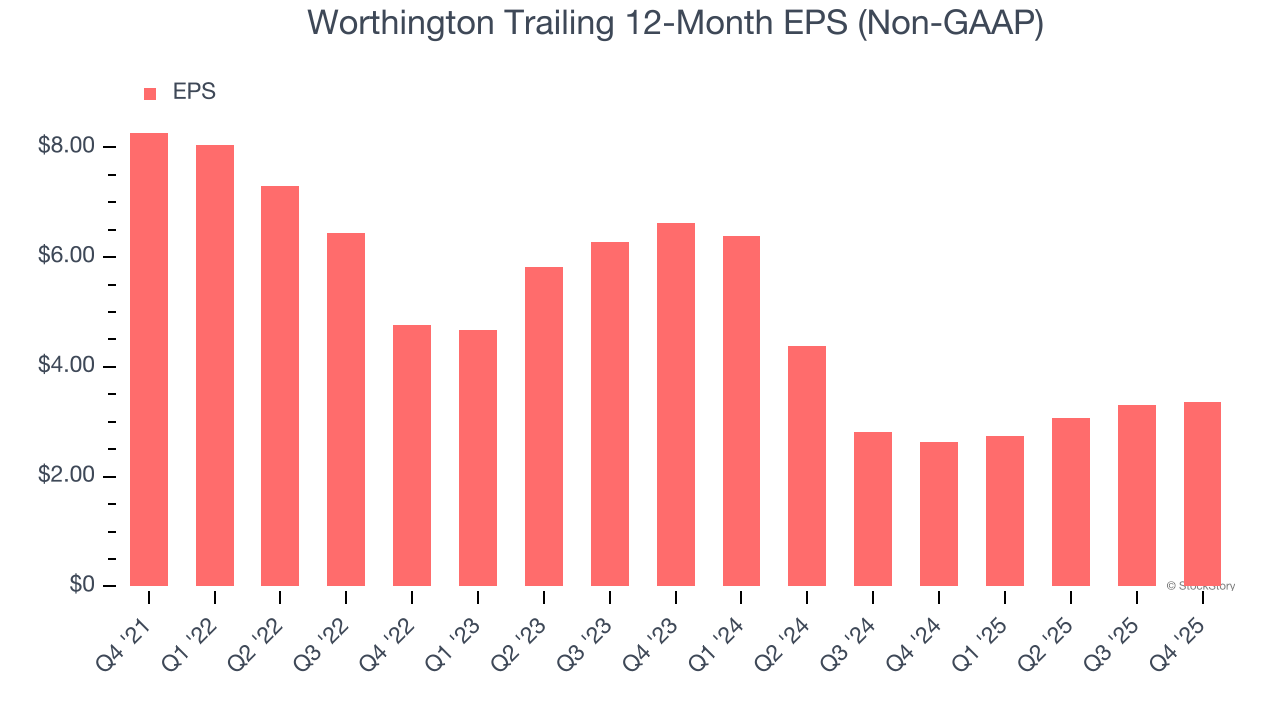
- Adjusted EPS: $0.65 vs analyst expectations of $0.70 (7.7% miss)
- Adjusted EBITDA: $60.48 million vs analyst estimates of $62.69 million (18.5% margin, 3.5% miss)
- Operating Margin: 3.7%, up from 1.3% in the same quarter last year
- Free Cash Flow Margin: 11.9%, similar to the same quarter last year
- Market Capitalization: $2.87 billion
“We delivered solid financial results for the quarter, achieving year-over-year growth in net sales, adjusted EPS and EBITDA, and free cash flow,” said Worthington Enterprises President and CEO Joe Hayek.
Company Overview
Founded by a steel salesman, Worthington (NYSE: WOR) specializes in steel processing, pressure cylinders, and engineered cabs for commercial markets.
Revenue Growth
A company’s long-term performance is an indicator of its overall quality. Any business can put up a good quarter or two, but the best consistently grow over the long haul. Worthington’s demand was weak over the last five years as its sales fell at a 14.9% annual rate. This wasn’t a great result and suggests it’s a low quality business.
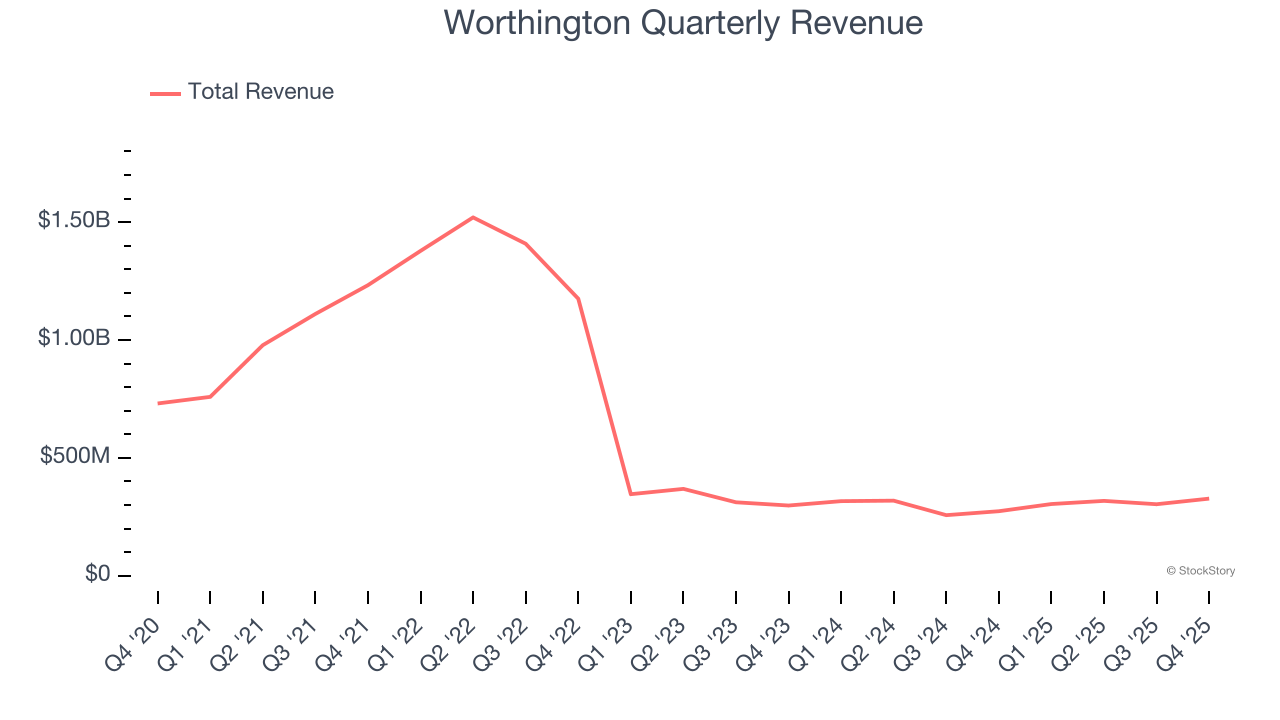
We at StockStory place the most emphasis on long-term growth, but within industrials, a half-decade historical view may miss cycles, industry trends, or a company capitalizing on catalysts such as a new contract win or a successful product line. Worthington’s annualized revenue declines of 2.7% over the last two years suggest its demand continued shrinking. 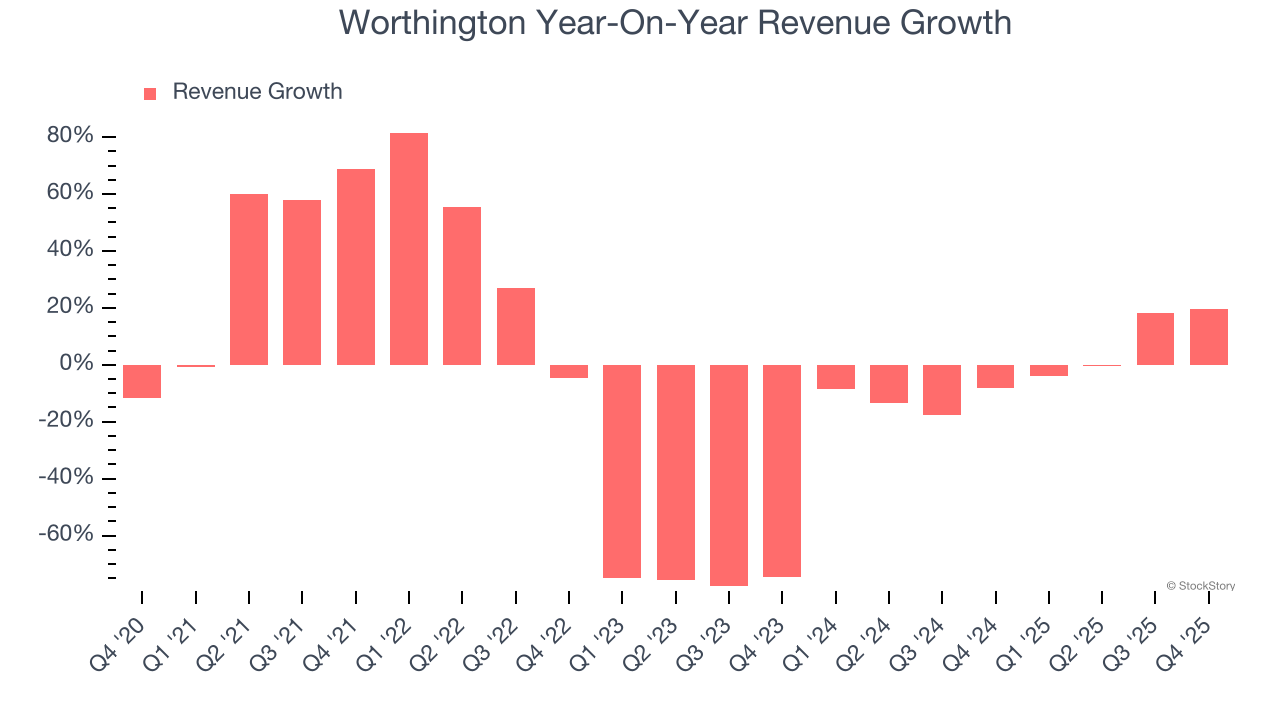
We can better understand the company’s revenue dynamics by analyzing its most important segments, Consumer Products and Building Products, which are 36.6% and 63.4% of revenue. Over the last two years, Worthington’s Consumer Products revenue (cylinders, torches, balloon kits, tools) was flat while its Building Products revenue (refrigerant, cylinders, tanks) averaged 7.2% year-on-year growth. 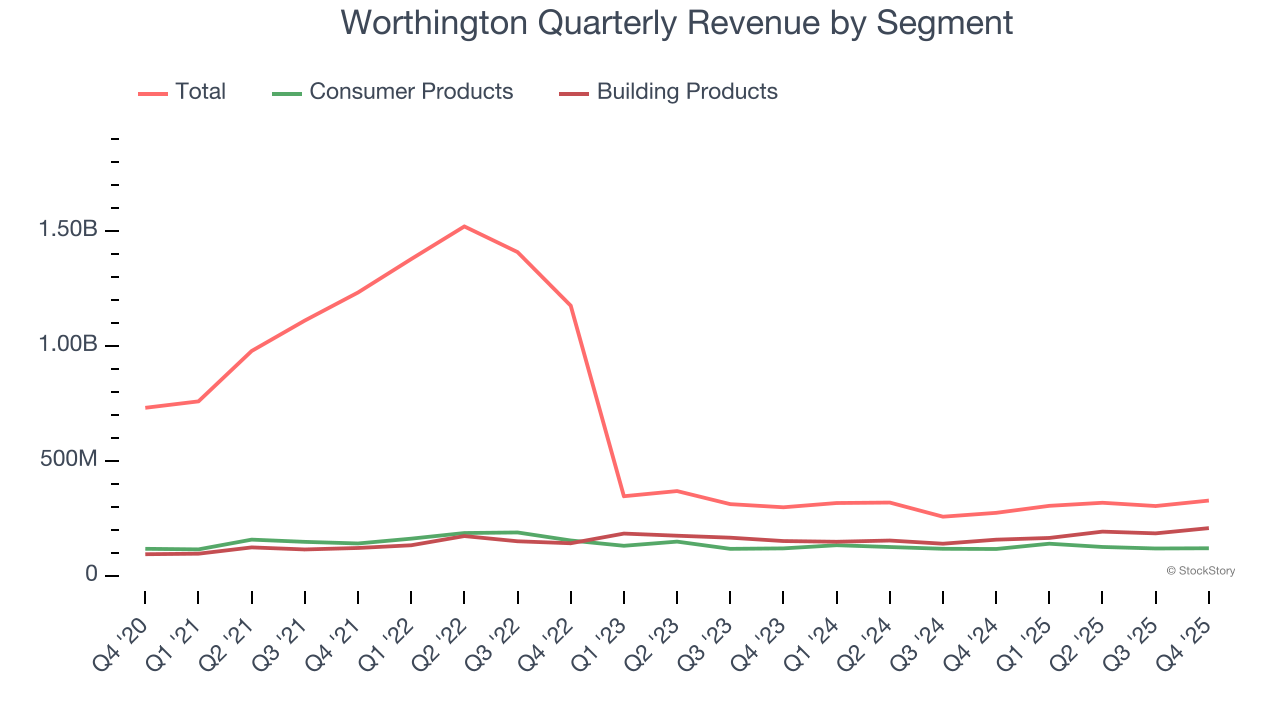
This quarter, Worthington reported year-on-year revenue growth of 19.5%, and its $327.5 million of revenue exceeded Wall Street’s estimates by 5.4%.
Looking ahead, sell-side analysts expect revenue to grow 6.7% over the next 12 months. While this projection suggests its newer products and services will fuel better top-line performance, it is still below average for the sector.
Microsoft, Alphabet, Coca-Cola, Monster Beverage—all began as under-the-radar growth stories riding a massive trend. We’ve identified the next one: a profitable AI semiconductor play Wall Street is still overlooking. Go here for access to our full report.
Operating Margin
Worthington was profitable over the last five years but held back by its large cost base. Its average operating margin of 3.8% was weak for an industrials business. This result isn’t too surprising given its low gross margin as a starting point.
Analyzing the trend in its profitability, Worthington’s operating margin decreased by 8.5 percentage points over the last five years. Worthington’s performance was poor no matter how you look at it - it shows that costs were rising and it couldn’t pass them onto its customers.
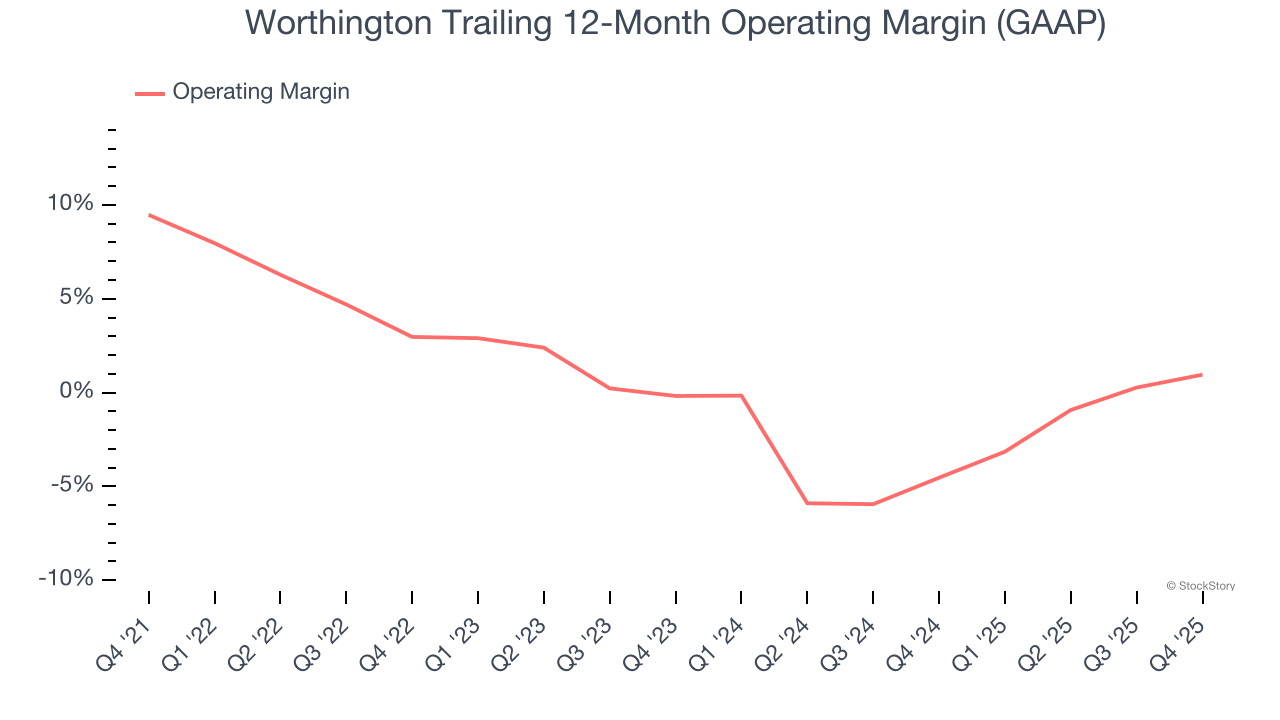
This quarter, Worthington generated an operating margin profit margin of 3.7%, up 2.5 percentage points year on year. The increase was encouraging, and because its gross margin actually decreased, we can assume it was more efficient because its operating expenses like marketing, R&D, and administrative overhead grew slower than its revenue.
Earnings Per Share
We track the long-term change in earnings per share (EPS) for the same reason as long-term revenue growth. Compared to revenue, however, EPS highlights whether a company’s growth is profitable.
Worthington’s EPS grew at a decent 8.8% compounded annual growth rate over the last five years, higher than its 14.9% annualized revenue declines. However, this alone doesn’t tell us much about its business quality because its operating margin didn’t improve.
Diving into Worthington’s quality of earnings can give us a better understanding of its performance. A five-year view shows that Worthington has repurchased its stock, shrinking its share count by 6.1%. This tells us its EPS outperformed its revenue not because of increased operational efficiency but financial engineering, as buybacks boost per share earnings. 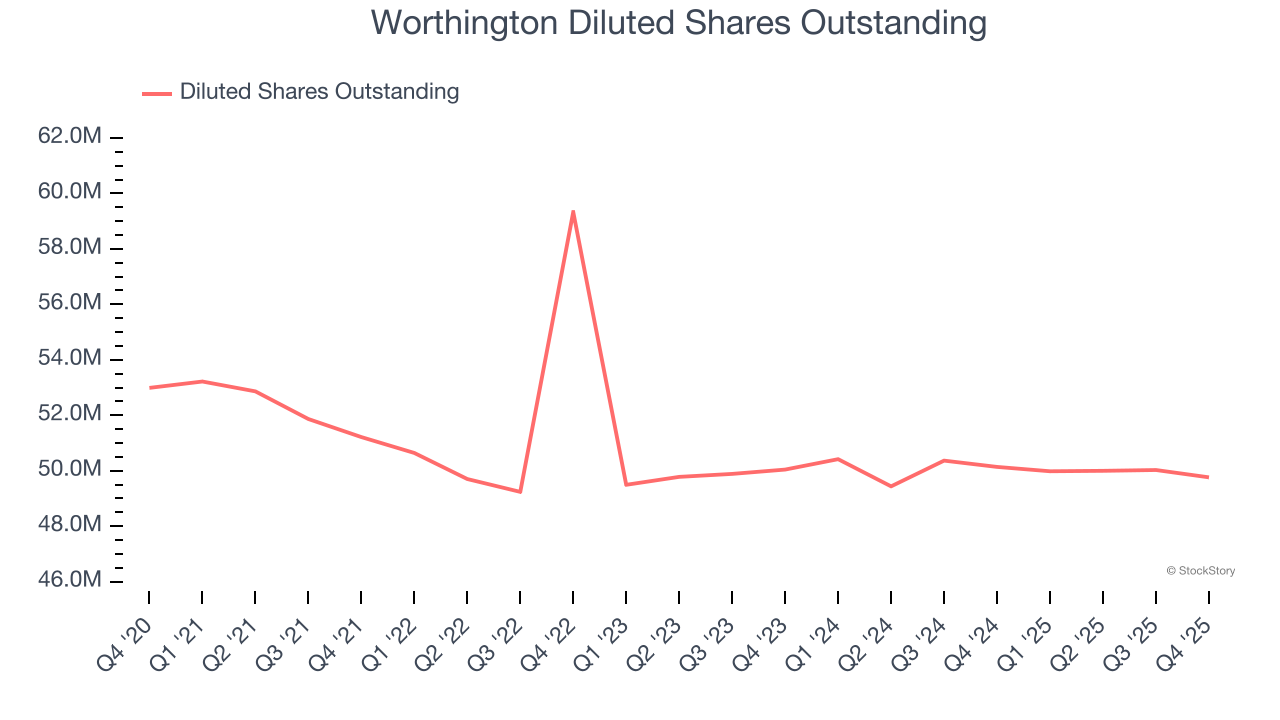
Like with revenue, we analyze EPS over a shorter period to see if we are missing a change in the business.
For Worthington, its two-year annual EPS declines of 28.8% mark a reversal from its five-year trend. We hope Worthington can return to earnings growth in the future.
In Q4, Worthington reported adjusted EPS of $0.65, up from $0.60 in the same quarter last year. Despite growing year on year, this print missed analysts’ estimates, but we care more about long-term adjusted EPS growth than short-term movements. Over the next 12 months, Wall Street expects Worthington’s full-year EPS of $3.36 to grow 12.4%.
Key Takeaways from Worthington’s Q4 Results
We were impressed by how significantly Worthington blew past analysts’ revenue expectations this quarter. We were also glad its Building Products revenue topped Wall Street’s estimates. On the other hand, its EPS missed and its EBITDA fell short of Wall Street’s estimates. Overall, this was a softer quarter. The stock traded down 7.7% to $51.96 immediately after reporting.
Worthington didn’t show it’s best hand this quarter, but does that create an opportunity to buy the stock right now? If you’re making that decision, you should consider the bigger picture of valuation, business qualities, as well as the latest earnings. We cover that in our actionable full research report which you can read here, it’s free for active Edge members.