

RV Manufacturer Winnebago (NYSE: WGO) reported Q4 CY2025 results exceeding the market’s revenue expectations, with sales up 12.3% year on year to $702.7 million. The company’s full-year revenue guidance of $2.9 billion at the midpoint came in 1.1% above analysts’ estimates. Its non-GAAP profit of $0.38 per share was significantly above analysts’ consensus estimates.
Is now the time to buy Winnebago? Find out by accessing our full research report, it’s free for active Edge members.
Winnebago (WGO) Q4 CY2025 Highlights:
- Revenue: $702.7 million vs analyst estimates of $633.5 million (12.3% year-on-year growth, 10.9% beat)
- Adjusted EPS: $0.38 vs analyst estimates of $0.14 (significant beat)
- Adjusted EBITDA: $30.2 million vs analyst estimates of $21.28 million (4.3% margin, 41.9% beat)
- The company lifted its revenue guidance for the full year to $2.9 billion at the midpoint from $2.85 billion, a 1.8% increase
- Management raised its full-year Adjusted EPS guidance to $2.45 at the midpoint, a 4.3% increase
- Operating Margin: 2%, up from -0.1% in the same quarter last year
- Free Cash Flow was $19.8 million, up from -$26.7 million in the same quarter last year
- Market Capitalization: $1.14 billion
CEO Commentary“Winnebago Industries performed ahead of our expectations in the first quarter and demonstrated clear progress on our priorities,” said Michael Happe, the Company’s President and Chief Executive Officer.
Company Overview
Created to provide high-quality, affordable RVs to the post-war American family, Winnebago (NYSE: WGO) is a manufacturer of recreational vehicles, providing a range of motorhomes, travel trailers, and fifth-wheel products for outdoor and adventure lifestyles.
Revenue Growth
A company’s long-term sales performance can indicate its overall quality. Any business can put up a good quarter or two, but the best consistently grow over the long haul. Regrettably, Winnebago’s sales grew at a sluggish 2.3% compounded annual growth rate over the last five years. This fell short of our benchmarks and is a tough starting point for our analysis.
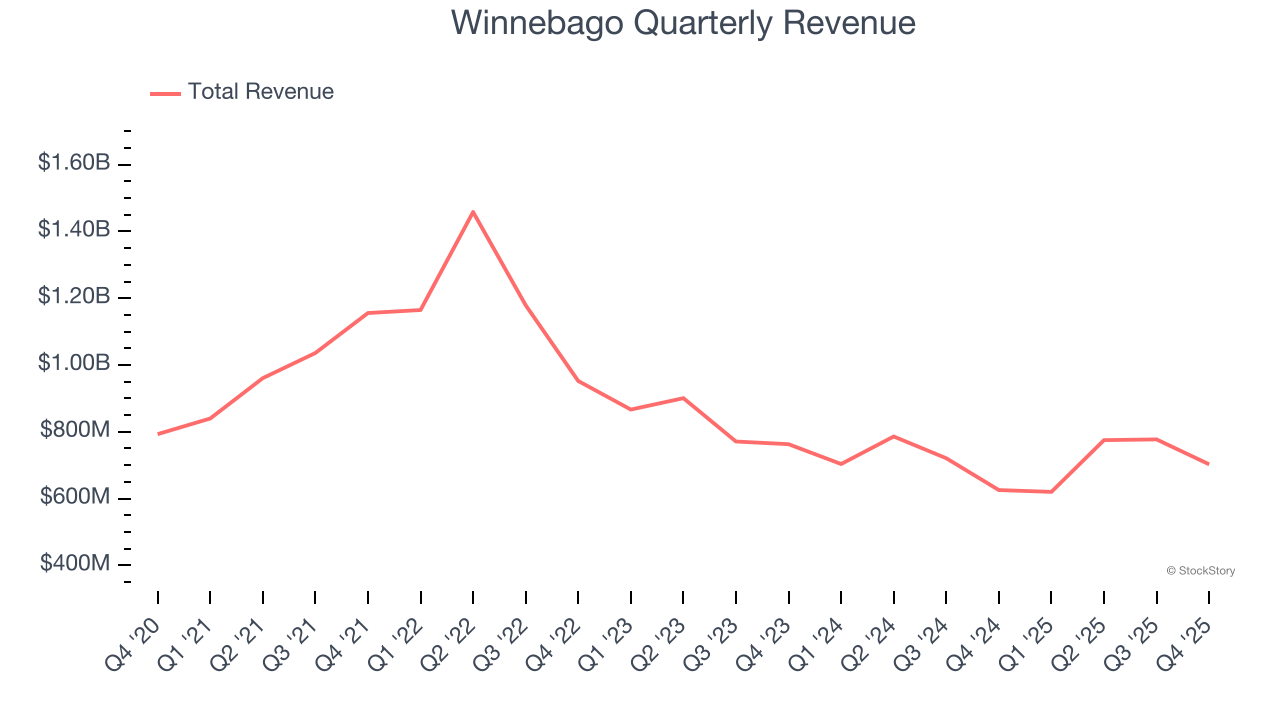
We at StockStory place the most emphasis on long-term growth, but within industrials, a half-decade historical view may miss cycles, industry trends, or a company capitalizing on catalysts such as a new contract win or a successful product line. Winnebago’s performance shows it grew in the past but relinquished its gains over the last two years, as its revenue fell by 6.7% annually. 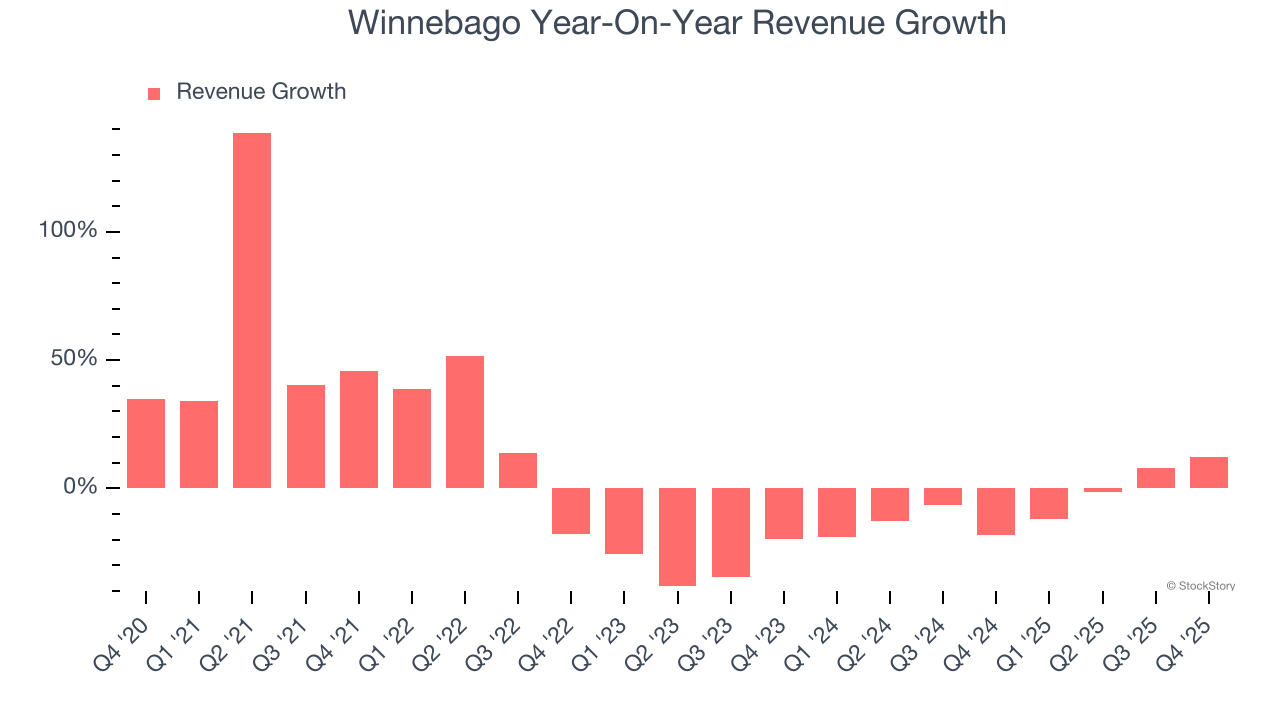
We can better understand the company’s revenue dynamics by analyzing its most important segments, Motorhomes and Towables, which are 43.9% and 41.8% of revenue. Over the last two years, Winnebago’s Motorhomes revenue (homes on wheels) averaged 7.5% year-on-year declines while its Towables revenue (non-motorized vehicles) averaged 4.6% declines. 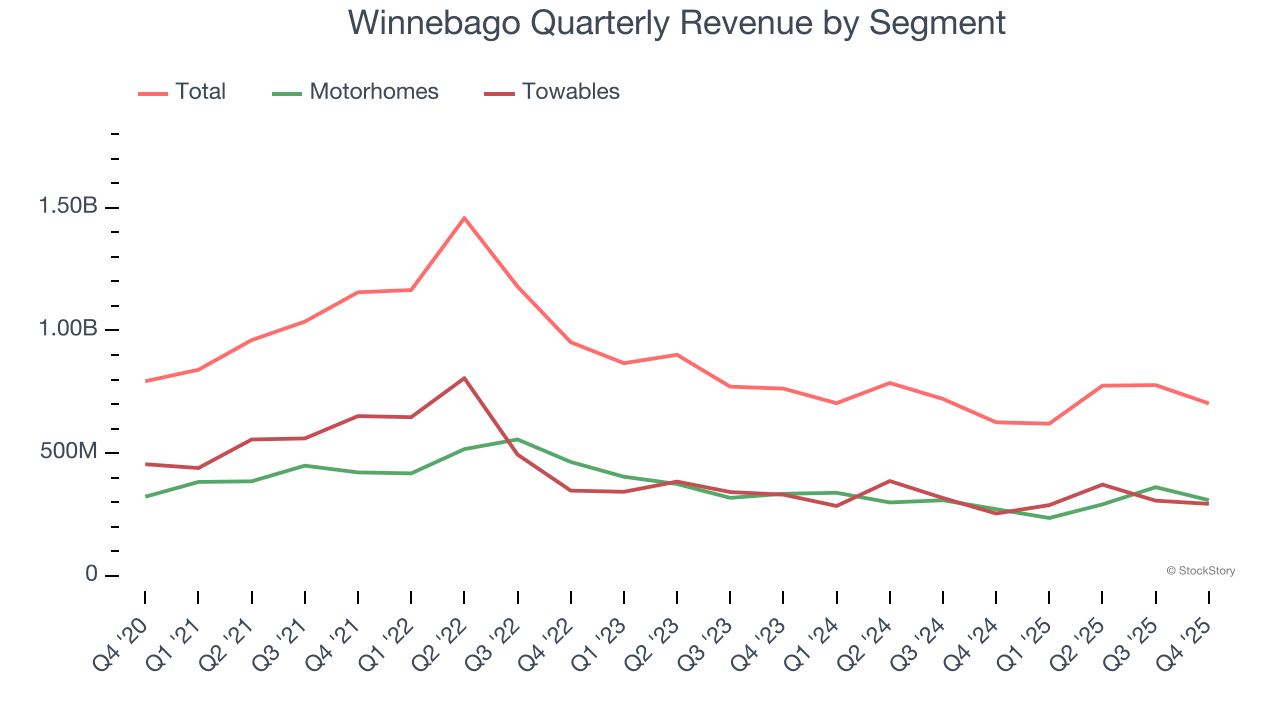
This quarter, Winnebago reported year-on-year revenue growth of 12.3%, and its $702.7 million of revenue exceeded Wall Street’s estimates by 10.9%.
Looking ahead, sell-side analysts expect revenue to remain flat over the next 12 months. Although this projection suggests its newer products and services will fuel better top-line performance, it is still below the sector average.
Microsoft, Alphabet, Coca-Cola, Monster Beverage—all began as under-the-radar growth stories riding a massive trend. We’ve identified the next one: a profitable AI semiconductor play Wall Street is still overlooking. Go here for access to our full report.
Operating Margin
Operating margin is one of the best measures of profitability because it tells us how much money a company takes home after procuring and manufacturing its products, marketing and selling those products, and most importantly, keeping them relevant through research and development.
Winnebago was profitable over the last five years but held back by its large cost base. Its average operating margin of 7.8% was weak for an industrials business. This result isn’t too surprising given its low gross margin as a starting point.
Looking at the trend in its profitability, Winnebago’s operating margin decreased by 9.2 percentage points over the last five years. This raises questions about the company’s expense base because its revenue growth should have given it leverage on its fixed costs, resulting in better economies of scale and profitability. Winnebago’s performance was poor no matter how you look at it - it shows that costs were rising and it couldn’t pass them onto its customers.
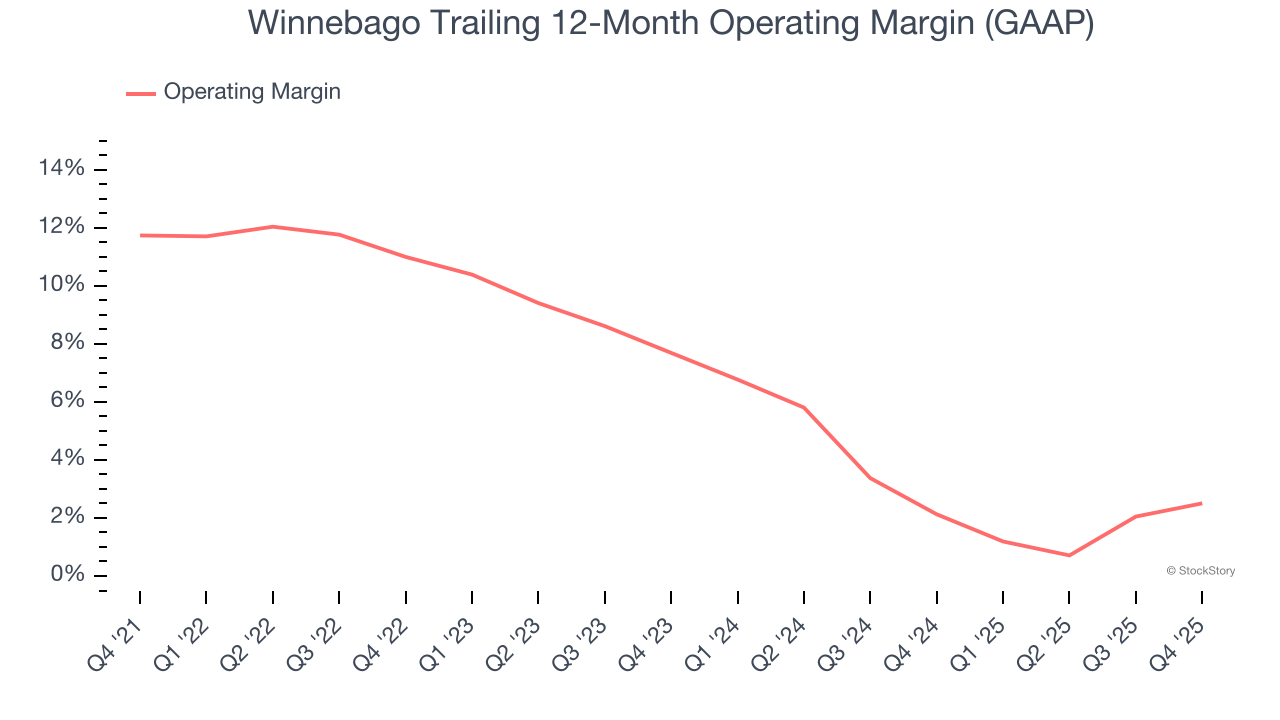
This quarter, Winnebago generated an operating margin profit margin of 2%, up 2.1 percentage points year on year. The increase was encouraging, and because its operating margin rose more than its gross margin, we can infer it was more efficient with expenses such as marketing, R&D, and administrative overhead.
Earnings Per Share
Revenue trends explain a company’s historical growth, but the long-term change in earnings per share (EPS) points to the profitability of that growth – for example, a company could inflate its sales through excessive spending on advertising and promotions.
Sadly for Winnebago, its EPS declined by 10.1% annually over the last five years while its revenue grew by 2.3%. This tells us the company became less profitable on a per-share basis as it expanded due to non-fundamental factors such as interest expenses and taxes.

We can take a deeper look into Winnebago’s earnings to better understand the drivers of its performance. As we mentioned earlier, Winnebago’s operating margin expanded this quarter but declined by 9.2 percentage points over the last five years. This was the most relevant factor (aside from the revenue impact) behind its lower earnings; interest expenses and taxes can also affect EPS but don’t tell us as much about a company’s fundamentals.
Like with revenue, we analyze EPS over a more recent period because it can provide insight into an emerging theme or development for the business.
For Winnebago, its two-year annual EPS declines of 44% show it’s continued to underperform. These results were bad no matter how you slice the data.
In Q4, Winnebago reported adjusted EPS of $0.38, up from negative $0.03 in the same quarter last year. This print easily cleared analysts’ estimates, and shareholders should be content with the results. Over the next 12 months, Wall Street expects Winnebago’s full-year EPS of $2.09 to grow 18.7%.
Key Takeaways from Winnebago’s Q4 Results
This was an encouraging 'beat and raise' quarter. Specifically, it was good to see Winnebago beat analysts’ EPS expectations this quarter on better revenue. Looking ahead, the company raised full-year guidance for both revenue and EPS. Zooming out, we think this quarter featured many important positives. The stock traded up 8.6% to $43.80 immediately following the results.
Winnebago may have had a good quarter, but does that mean you should invest right now? What happened in the latest quarter matters, but not as much as longer-term business quality and valuation, when deciding whether to invest in this stock. We cover that in our actionable full research report which you can read here, it’s free for active Edge members.


