

Insurance brokerage firm Brown & Brown (NYSE: BRO) reported Q3 CY2025 results exceeding the market’s revenue expectations, with sales up 35.4% year on year to $1.61 billion largely due to M&A and profit-sharing contingent commissions. Its non-GAAP profit of $1.05 per share was 12.9% above analysts’ consensus estimates.
Is now the time to buy Brown & Brown? Find out by accessing our full research report, it’s free for active Edge members.
Brown & Brown (BRO) Q3 CY2025 Highlights:
- Revenue: $1.61 billion vs analyst estimates of $1.55 billion (35.4% year-on-year growth largely due to M&A and profit-sharing contingent commissions, 3.9% beat)
- Adjusted EPS: $1.05 vs analyst estimates of $0.93 (12.9% beat)
- Adjusted EBITDA: $518 million vs analyst estimates of $537.5 million (32.3% margin, 3.6% miss)
- Operating Margin: 19.4%, down from 26.7% in the same quarter last year
- Free Cash Flow Margin: 28.1%, down from 35.2% in the same quarter last year
- Organic Revenue rose 3.5% year on year vs analyst estimates of 3.9% growth (31.5 basis point miss)
- Market Capitalization: $27.44 billion
Company Overview
With roots dating back to 1939 and operations spanning 44 U.S. states and 14 countries, Brown & Brown (NYSE: BRO) is an insurance brokerage and risk management firm that markets and sells insurance products across property, casualty, and employee benefits sectors.
Revenue Growth
Reviewing a company’s long-term sales performance reveals insights into its quality. Even a bad business can shine for one or two quarters, but a top-tier one grows for years.
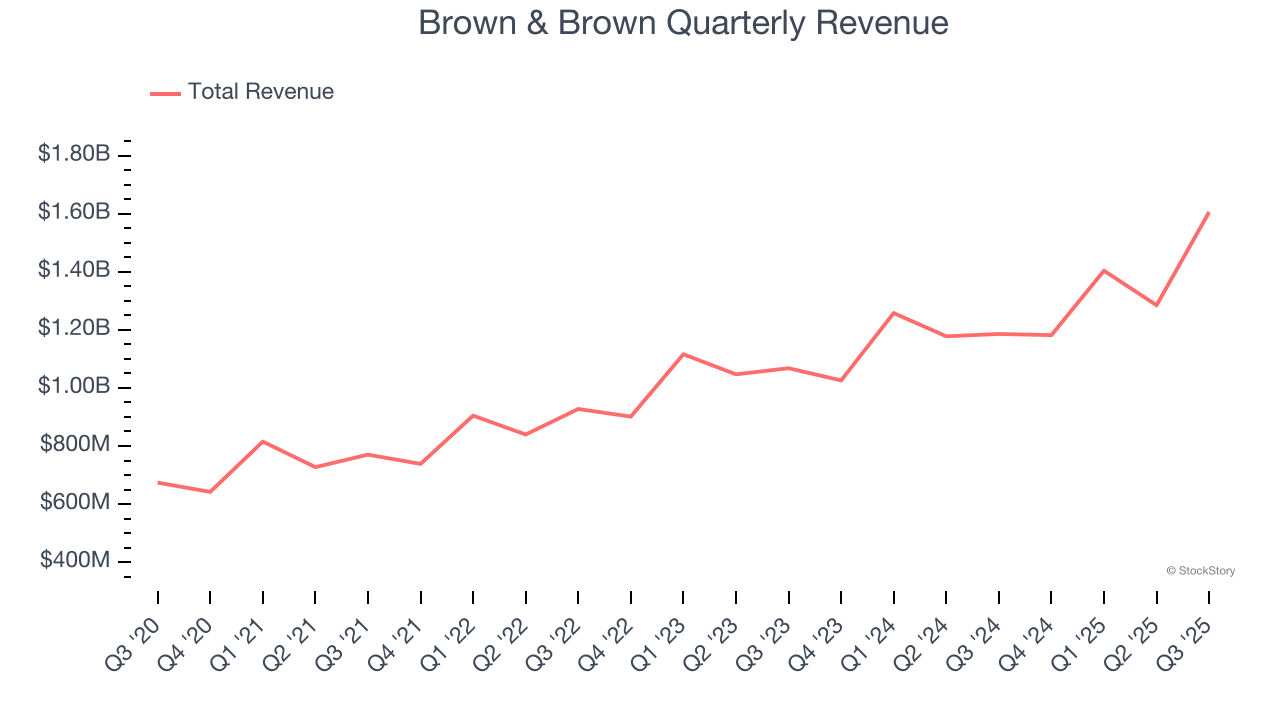
With $5.48 billion in revenue over the past 12 months, Brown & Brown is one of the larger companies in the business services industry and benefits from a well-known brand that influences purchasing decisions.
As you can see below, Brown & Brown’s sales grew at an incredible 16.5% compounded annual growth rate over the last five years. This is a great starting point for our analysis because it shows Brown & Brown’s demand was higher than many business services companies.
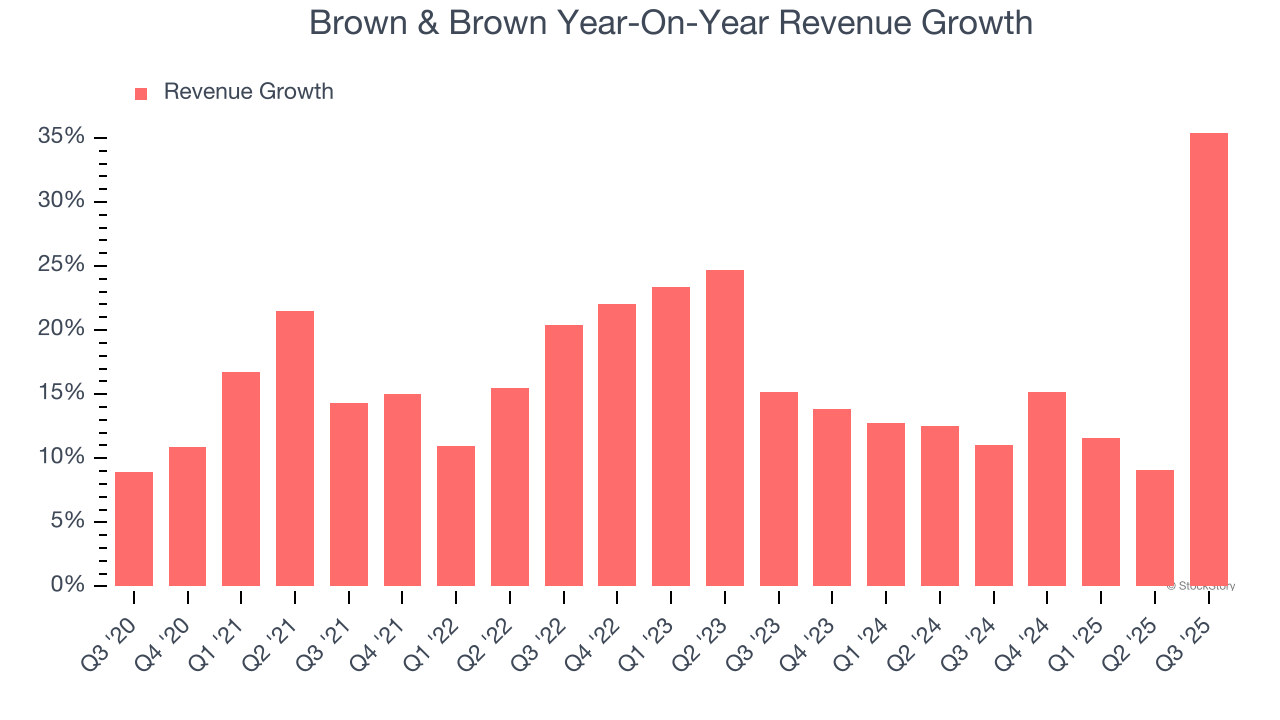
We at StockStory place the most emphasis on long-term growth, but within business services, a half-decade historical view may miss recent innovations or disruptive industry trends. Brown & Brown’s annualized revenue growth of 15.1% over the last two years is below its five-year trend, but we still think the results suggest healthy demand.
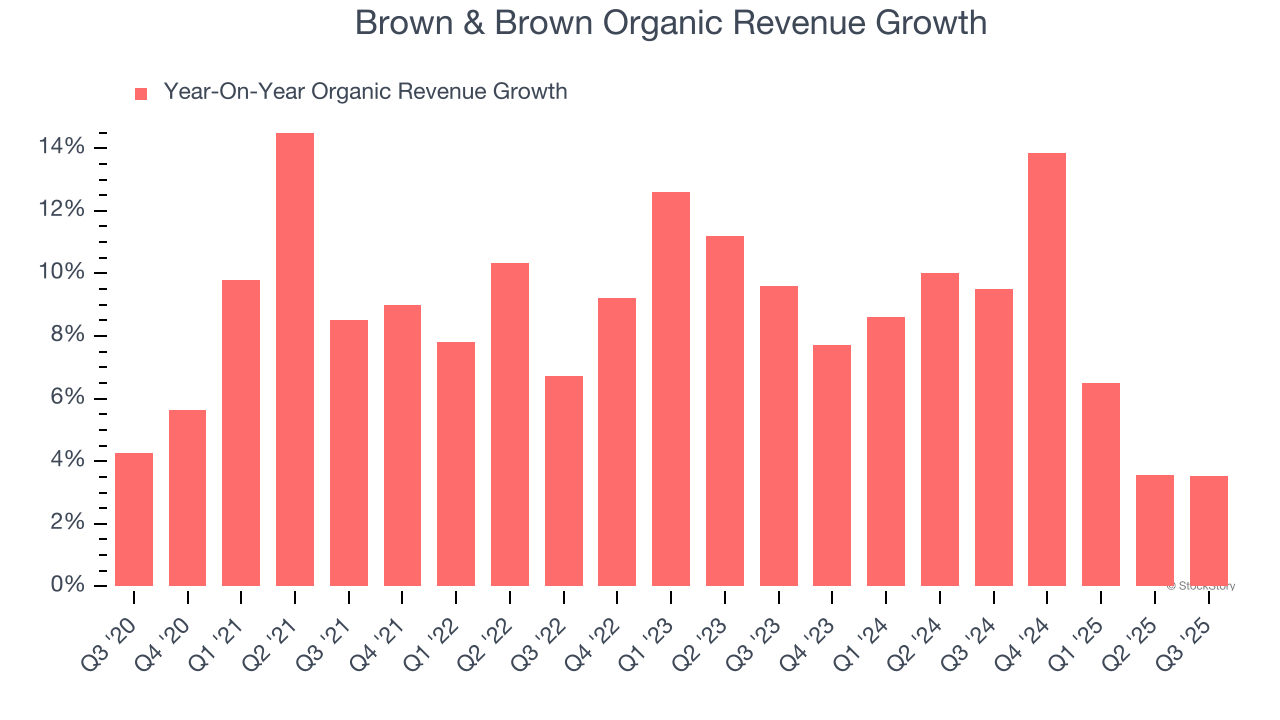
Brown & Brown also reports organic revenue, which strips out one-time events like acquisitions and currency fluctuations that don’t accurately reflect its fundamentals. Over the last two years, Brown & Brown’s organic revenue averaged 7.9% year-on-year growth. Because this number is lower than its two-year revenue growth, we can see that some mixture of acquisitions and foreign exchange rates boosted its headline results.
This quarter, Brown & Brown reported year-on-year revenue growth of 35.4% largely due to M&A and profit-sharing contingent commissions, and its $1.61 billion of revenue exceeded Wall Street’s estimates by 3.9%.
Looking ahead, sell-side analysts expect revenue to grow 31.6% over the next 12 months, an improvement versus the last two years. This projection is eye-popping and indicates its newer products and services will catalyze better top-line performance.
Microsoft, Alphabet, Coca-Cola, Monster Beverage—all began as under-the-radar growth stories riding a massive trend. We’ve identified the next one: a profitable AI semiconductor play Wall Street is still overlooking. Go here for access to our full report.
Adjusted Operating Margin
Adjusted operating margin is one of the best measures of profitability because it tells us how much money a company takes home after subtracting all core expenses, like marketing and R&D. It also removes various one-time costs to paint a better picture of normalized profits.
Brown & Brown has been a well-oiled machine over the last five years. It demonstrated elite profitability for a business services business, boasting an average adjusted operating margin of 25.5%.
Looking at the trend in its profitability, Brown & Brown’s adjusted operating margin decreased by 1.3 percentage points over the last five years. This raises questions about the company’s expense base because its revenue growth should have given it leverage on its fixed costs, resulting in better economies of scale and profitability.
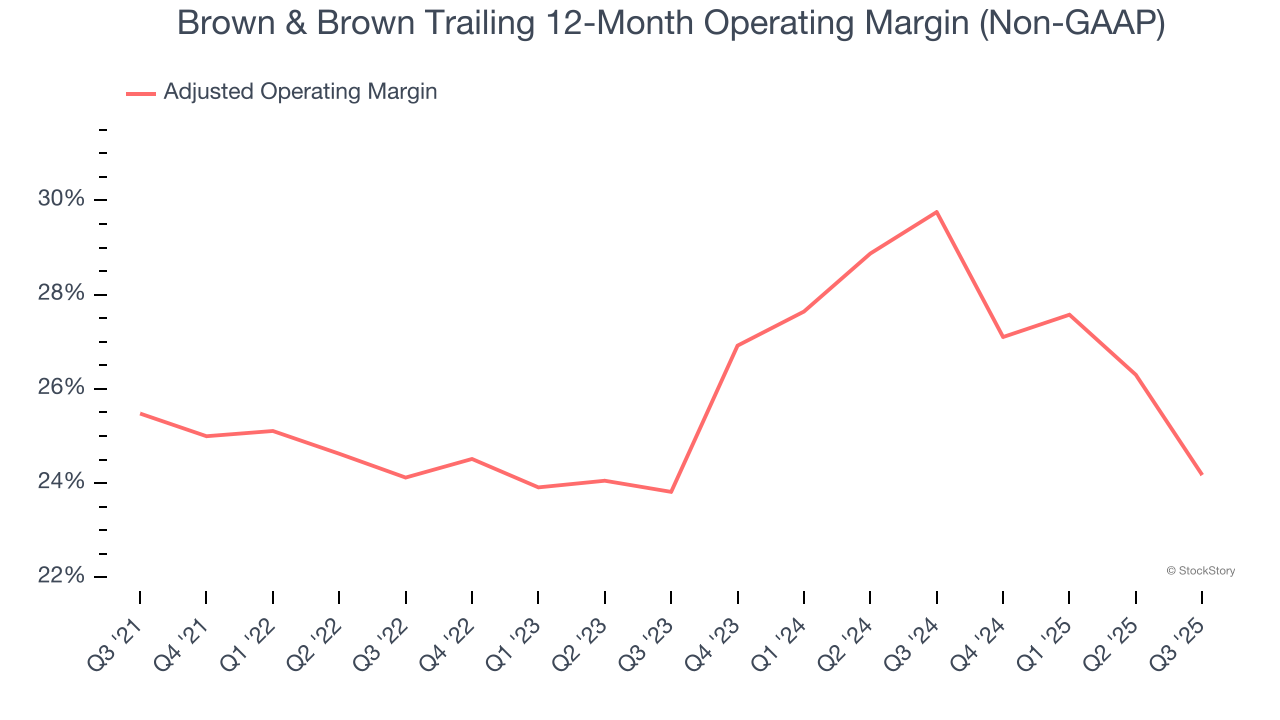
In Q3, Brown & Brown generated an adjusted operating margin profit margin of 19.4%, down 7.4 percentage points year on year. This contraction shows it was less efficient because its expenses grew faster than its revenue.
Earnings Per Share
Revenue trends explain a company’s historical growth, but the long-term change in earnings per share (EPS) points to the profitability of that growth – for example, a company could inflate its sales through excessive spending on advertising and promotions.
Brown & Brown’s EPS grew at an astounding 20.7% compounded annual growth rate over the last five years, higher than its 16.5% annualized revenue growth. However, we take this with a grain of salt because its adjusted operating margin didn’t improve and it didn’t repurchase its shares, meaning the delta came from reduced interest expenses or taxes.
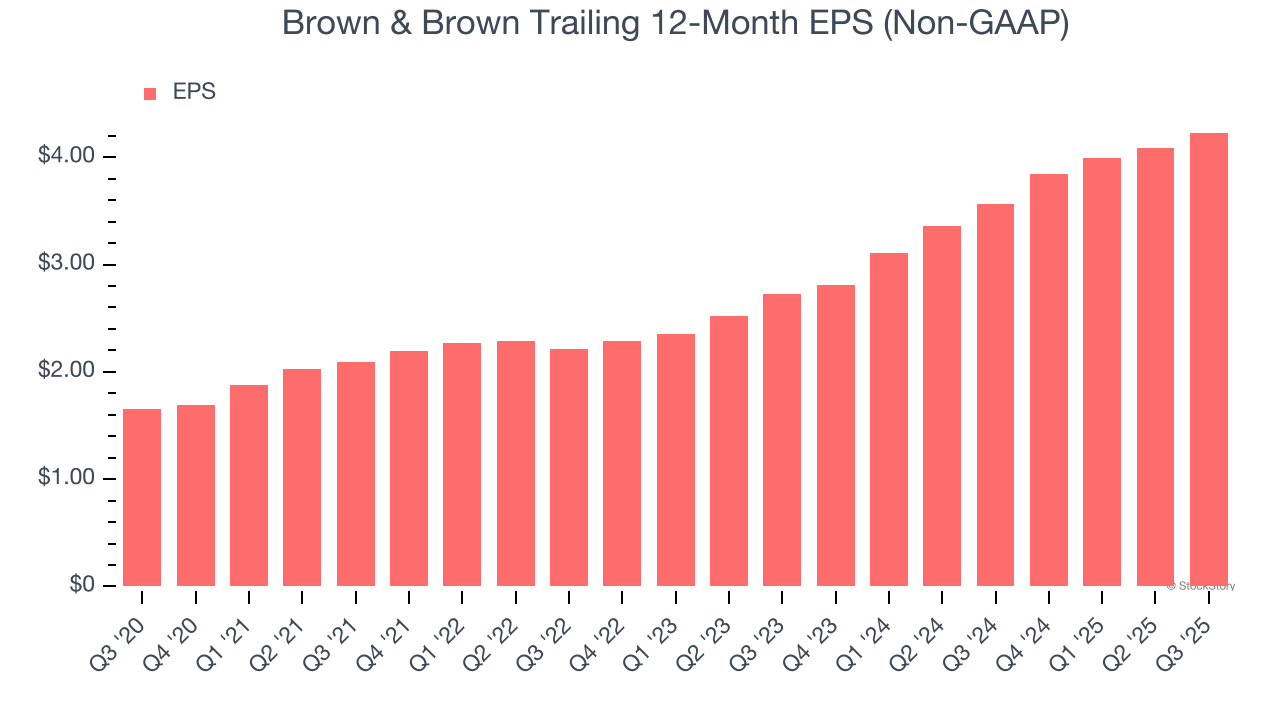
Like with revenue, we analyze EPS over a shorter period to see if we are missing a change in the business.
For Brown & Brown, its two-year annual EPS growth of 24.5% was higher than its five-year trend. We love it when earnings growth accelerates, especially when it accelerates off an already high base.
In Q3, Brown & Brown reported adjusted EPS of $1.05, up from $0.91 in the same quarter last year. This print easily cleared analysts’ estimates, and shareholders should be content with the results. Over the next 12 months, Wall Street expects Brown & Brown’s full-year EPS of $4.23 to grow 7.6%.
Key Takeaways from Brown & Brown’s Q3 Results
It was good to see Brown & Brown beat analysts’ EPS expectations this quarter. We were also glad its revenue outperformed Wall Street’s estimates. On the other hand, its organic revenue was in line. Zooming out, we think this was a solid print. The stock remained flat at $79.60 immediately after reporting.
So do we think Brown & Brown is an attractive buy at the current price? We think that the latest quarter is only one piece of the longer-term business quality puzzle. Quality, when combined with valuation, can help determine if the stock is a buy. We cover that in our actionable full research report which you can read here, it’s free for active Edge members.


