

Building materials distributor GMS (NYSE: GMS) reported Q1 CY2025 results topping the market’s revenue expectations, but sales fell by 5.6% year on year to $1.33 billion. Its non-GAAP profit of $1.29 per share was 15.9% above analysts’ consensus estimates.
Is now the time to buy GMS? Find out by accessing our full research report, it’s free.
GMS (GMS) Q1 CY2025 Highlights:
- Revenue: $1.33 billion vs analyst estimates of $1.30 billion (5.6% year-on-year decline, 2.9% beat)
- Adjusted EPS: $1.29 vs analyst estimates of $1.11 (15.9% beat)
- Adjusted EBITDA: $109.8 million vs analyst estimates of $104.5 million (8.2% margin, 5.1% beat)
- Operating Margin: 4.5%, down from 7.1% in the same quarter last year
- Free Cash Flow Margin: 13.7%, similar to the same quarter last year
- Organic Revenue fell 9.7% year on year (5.5% in the same quarter last year)
- Market Capitalization: $2.81 billion
“We reported solid results for our fourth quarter and full year fiscal 2025 despite deterioration in end market conditions as we moved through the year,” said John C. Turner, Jr, President and Chief Executive Officer of GMS.
Company Overview
Founded in 1971, GMS (NYSE: GMS) distributes specialty building materials including wallboard, ceilings, and insulation products, to the construction industry.
Revenue Growth
Examining a company’s long-term performance can provide clues about its quality. Any business can put up a good quarter or two, but the best consistently grow over the long haul. Over the last five years, GMS grew its sales at an impressive 11.2% compounded annual growth rate. Its growth beat the average industrials company and shows its offerings resonate with customers.
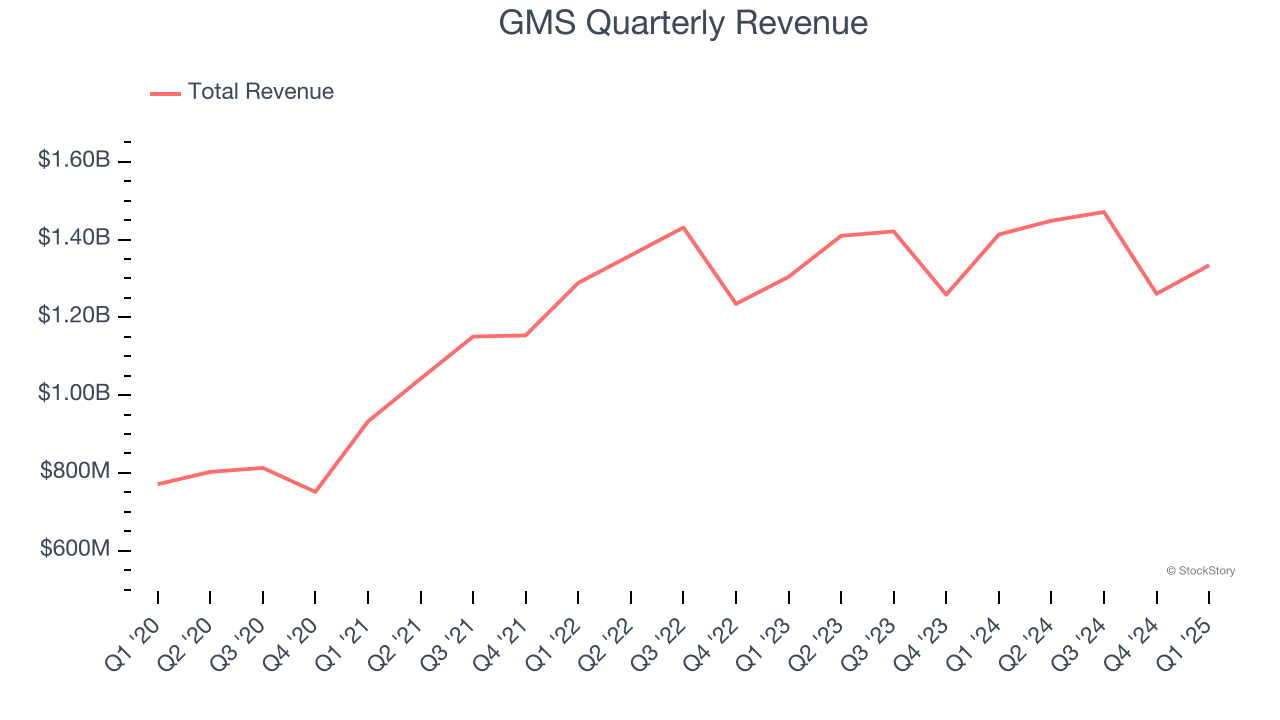
We at StockStory place the most emphasis on long-term growth, but within industrials, a half-decade historical view may miss cycles, industry trends, or a company capitalizing on catalysts such as a new contract win or a successful product line. GMS’s recent performance shows its demand has slowed significantly as its annualized revenue growth of 1.7% over the last two years was well below its five-year trend. 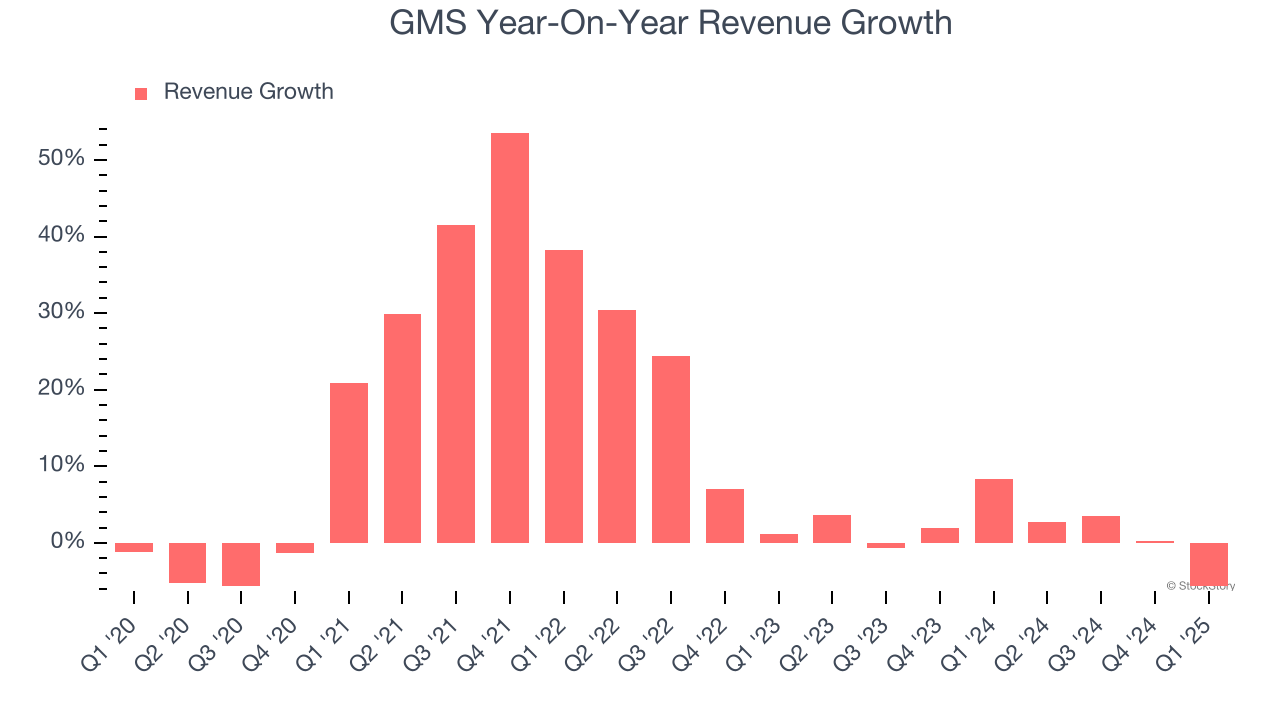
GMS also reports organic revenue, which strips out one-time events like acquisitions and currency fluctuations that don’t accurately reflect its fundamentals. Over the last two years, GMS’s organic revenue averaged 2.4% year-on-year declines. Because this number is lower than its normal revenue growth, we can see that some mixture of acquisitions and foreign exchange rates boosted its headline results. 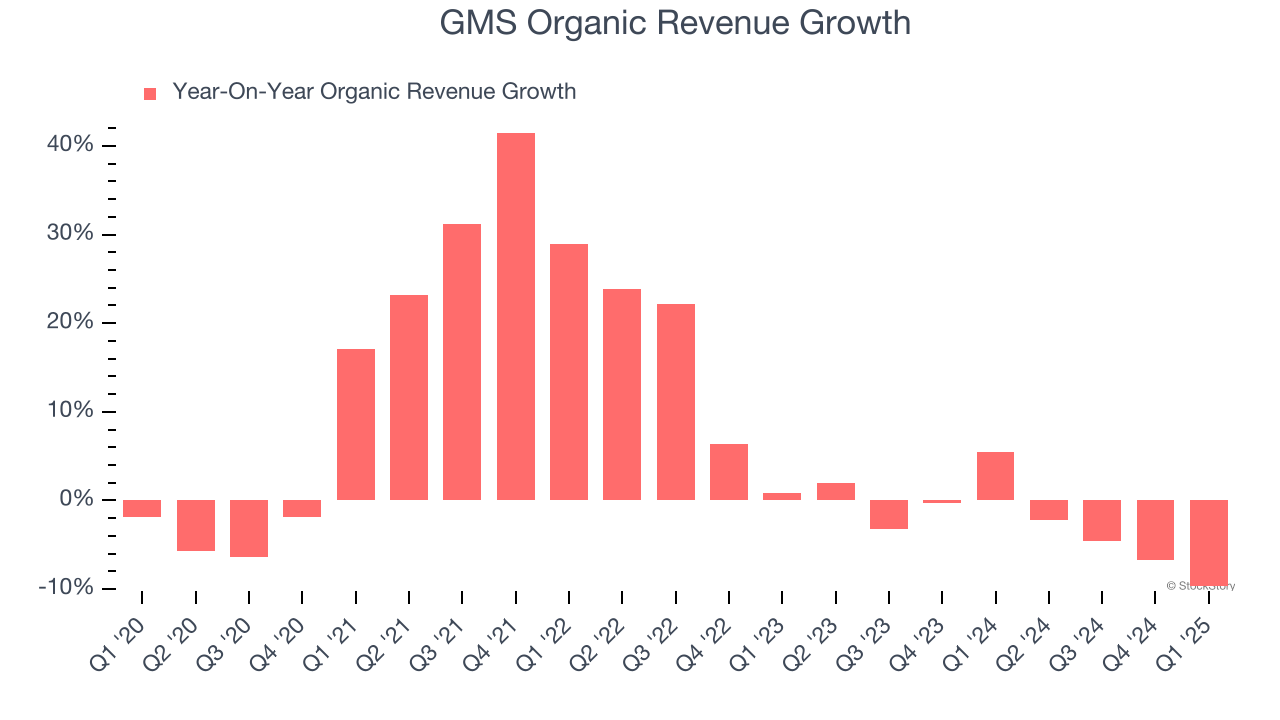
This quarter, GMS’s revenue fell by 5.6% year on year to $1.33 billion but beat Wall Street’s estimates by 2.9%.
Looking ahead, sell-side analysts expect revenue to decline by 1.2% over the next 12 months, a slight deceleration versus the last two years. This projection is underwhelming and implies its products and services will face some demand challenges.
Software is eating the world and there is virtually no industry left that has been untouched by it. That drives increasing demand for tools helping software developers do their jobs, whether it be monitoring critical cloud infrastructure, integrating audio and video functionality, or ensuring smooth content streaming. Click here to access a free report on our 3 favorite stocks to play this generational megatrend.
Operating Margin
GMS was profitable over the last five years but held back by its large cost base. Its average operating margin of 7.5% was weak for an industrials business.
Analyzing the trend in its profitability, GMS’s operating margin decreased by 1.1 percentage points over the last five years. This raises questions about the company’s expense base because its revenue growth should have given it leverage on its fixed costs, resulting in better economies of scale and profitability. GMS’s performance was poor no matter how you look at it - it shows that costs were rising and it couldn’t pass them onto its customers.
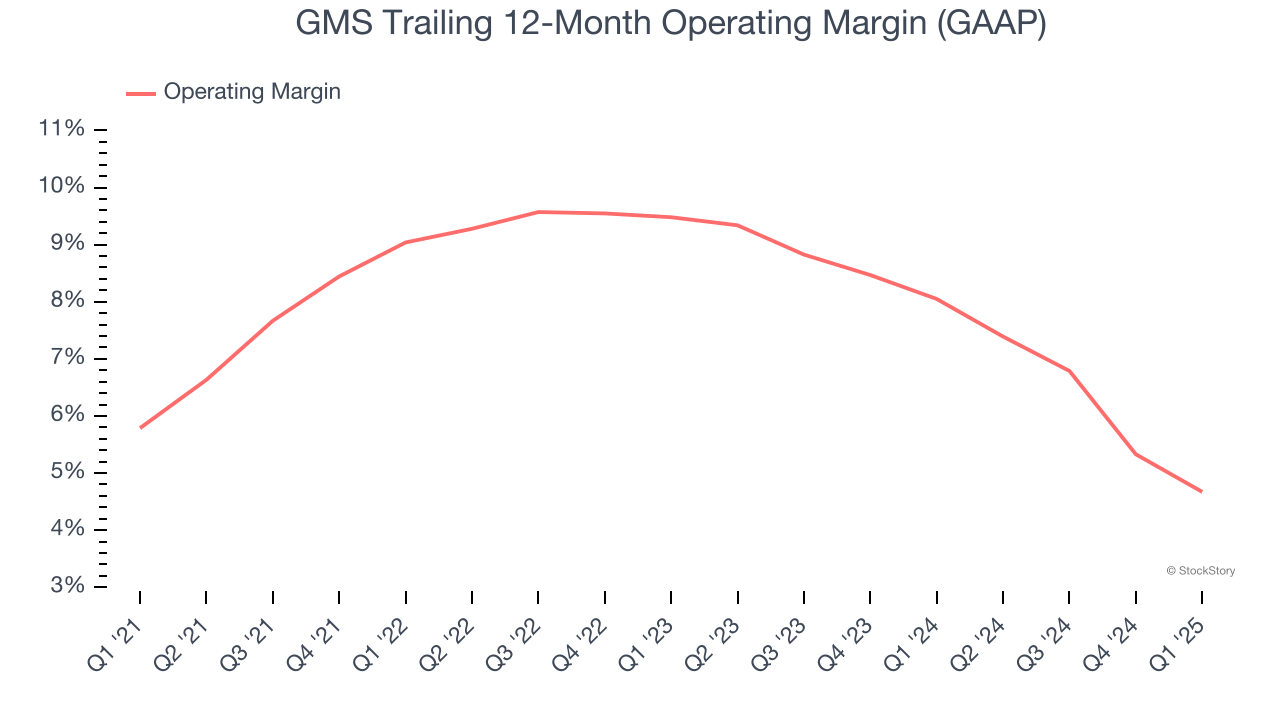
This quarter, GMS generated an operating margin profit margin of 4.5%, down 2.6 percentage points year on year. Since GMS’s operating margin decreased more than its gross margin, we can assume it was less efficient because expenses such as marketing, R&D, and administrative overhead increased.
Earnings Per Share
We track the long-term change in earnings per share (EPS) for the same reason as long-term revenue growth. Compared to revenue, however, EPS highlights whether a company’s growth is profitable.
GMS’s EPS grew at a spectacular 15.7% compounded annual growth rate over the last five years, higher than its 11.2% annualized revenue growth. However, this alone doesn’t tell us much about its business quality because its operating margin didn’t improve.
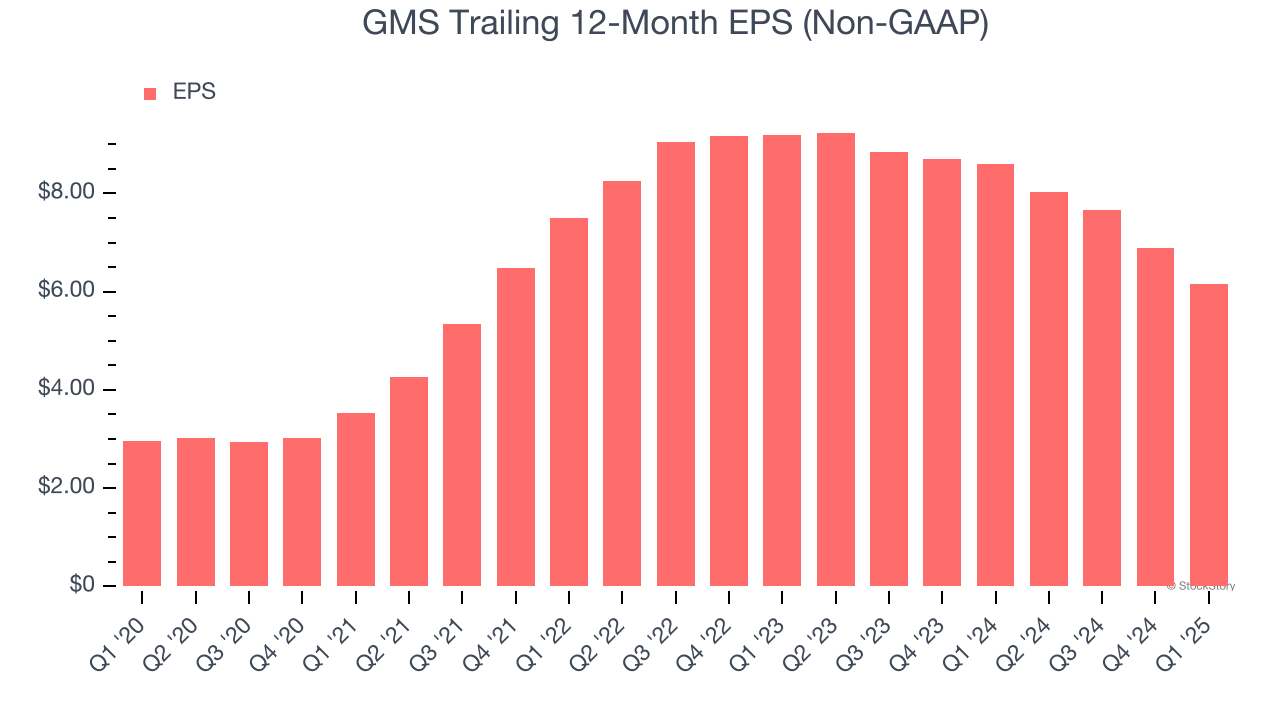
We can take a deeper look into GMS’s earnings quality to better understand the drivers of its performance. A five-year view shows that GMS has repurchased its stock, shrinking its share count by 8.5%. This tells us its EPS outperformed its revenue not because of increased operational efficiency but financial engineering, as buybacks boost per share earnings. 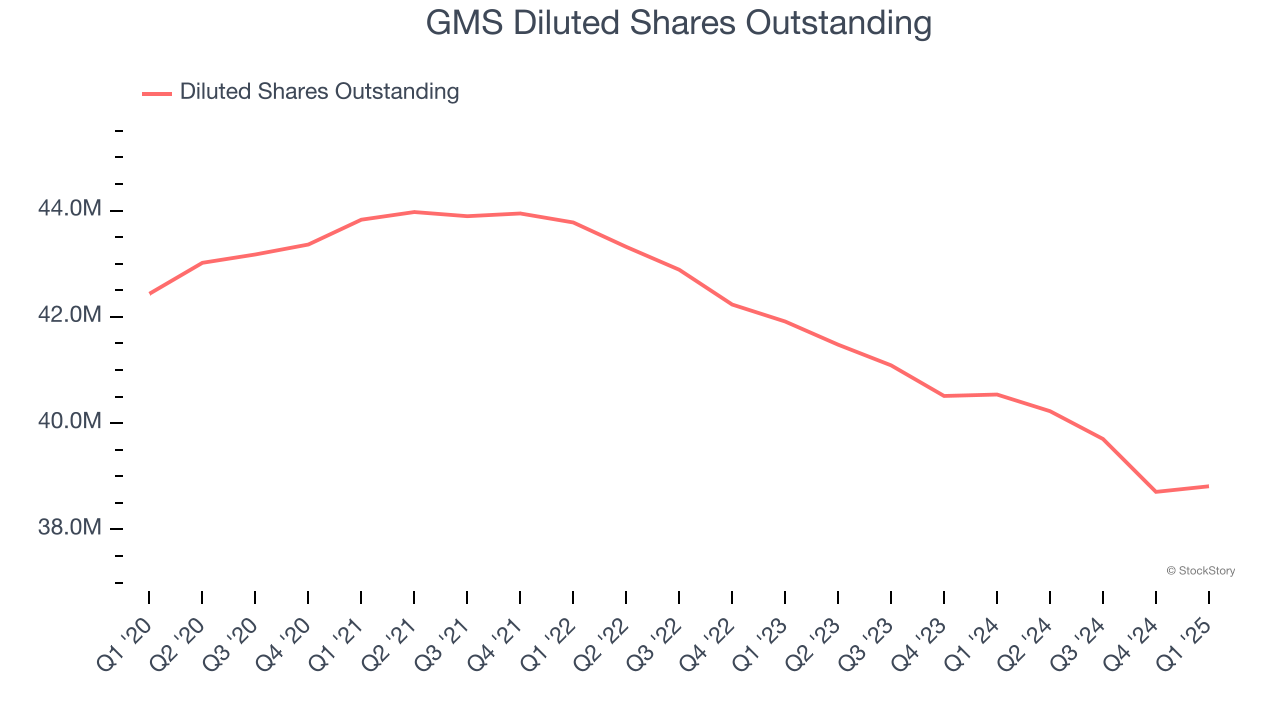
Like with revenue, we analyze EPS over a more recent period because it can provide insight into an emerging theme or development for the business.
For GMS, its two-year annual EPS declines of 18.1% mark a reversal from its (seemingly) healthy five-year trend. We hope GMS can return to earnings growth in the future.
In Q1, GMS reported EPS at $1.29, down from $2.01 in the same quarter last year. Despite falling year on year, this print easily cleared analysts’ estimates. Over the next 12 months, Wall Street expects GMS’s full-year EPS of $6.16 to stay about the same.
Key Takeaways from GMS’s Q1 Results
We were impressed by how significantly GMS blew past analysts’ organic revenue expectations this quarter. We were also glad its revenue outperformed Wall Street’s estimates. Zooming out, we think this was a solid print. The stock remained flat at $73.50 immediately after reporting.
Sure, GMS had a solid quarter, but if we look at the bigger picture, is this stock a buy? What happened in the latest quarter matters, but not as much as longer-term business quality and valuation, when deciding whether to invest in this stock. We cover that in our actionable full research report which you can read here, it’s free.


