

Commercial rental vehicle and delivery company Ryder (NYSE: R) missed Wall Street’s revenue expectations in Q4 CY2025, with sales flat year on year at $3.18 billion. Its non-GAAP profit of $3.59 per share was in line with analysts’ consensus estimates.
Is now the time to buy Ryder? Find out by accessing our full research report, it’s free.
Ryder (R) Q4 CY2025 Highlights:
- Revenue: $3.18 billion vs analyst estimates of $3.20 billion (flat year on year, 0.7% miss)
- Adjusted EPS: $3.59 vs analyst expectations of $3.57 (in line)
- Adjusted EBITDA: $726 million vs analyst estimates of $731 million (22.9% margin, 0.7% miss)
- Adjusted EPS guidance for the upcoming financial year 2026 is $13.95 at the midpoint, missing analyst estimates by 4.6%
- Operating Margin: 8.8%, in line with the same quarter last year
- Free Cash Flow was $450 million, up from -$203 million in the same quarter last year
- Market Capitalization: $8.57 billion
Company Overview
As one of the first companies to introduce the idea of leasing trucks, Ryder (NYSE: R) provides rental vehicles to businesses and delivers packages directly to homes or businesses.
Revenue Growth
A company’s long-term sales performance is one signal of its overall quality. Any business can put up a good quarter or two, but many enduring ones grow for years. Over the last five years, Ryder grew its sales at a decent 8.5% compounded annual growth rate. Its growth was slightly above the average industrials company and shows its offerings resonate with customers.
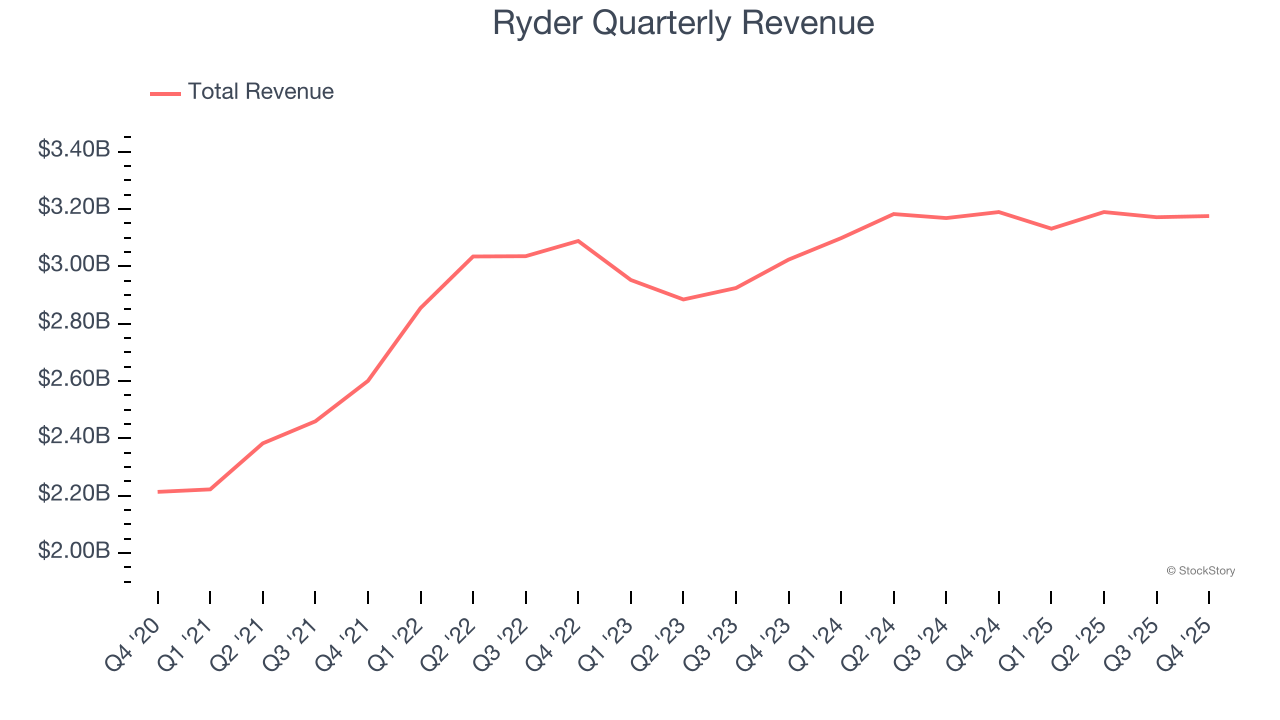
Long-term growth is the most important, but within industrials, a half-decade historical view may miss new industry trends or demand cycles. Ryder’s recent performance shows its demand has slowed as its annualized revenue growth of 3.7% over the last two years was below its five-year trend. 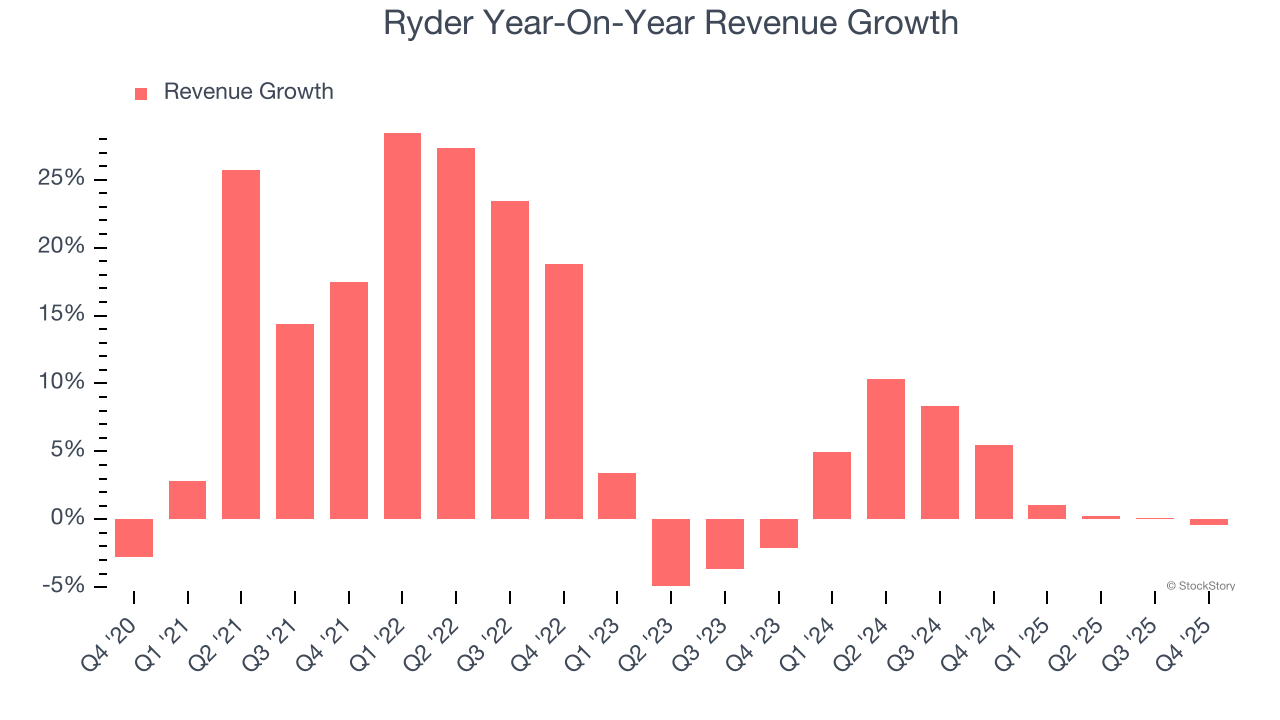
We can dig further into the company’s revenue dynamics by analyzing its most important segments, Fleet Management Solutions and Supply Chain Solutions, which are 46.2% and 43.5% of revenue. Over the last two years, Ryder’s Fleet Management Solutions revenue (leasing and rental) was flat while its Supply Chain Solutions revenue ( designing and managing customers' distribution) averaged 5.9% year-on-year growth. 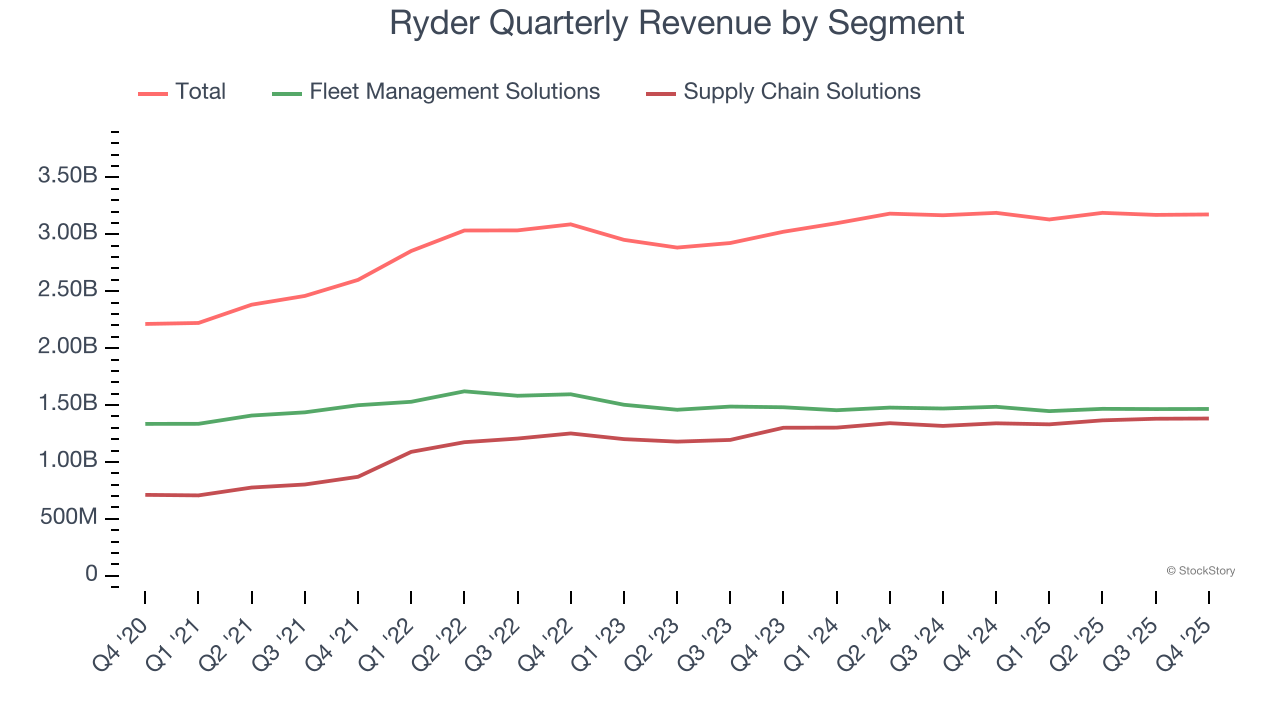
This quarter, Ryder missed Wall Street’s estimates and reported a rather uninspiring 0.4% year-on-year revenue decline, generating $3.18 billion of revenue.
Looking ahead, sell-side analysts expect revenue to grow 3.1% over the next 12 months, similar to its two-year rate. This projection doesn't excite us and implies its newer products and services will not lead to better top-line performance yet.
While Wall Street chases Nvidia at all-time highs, an under-the-radar semiconductor supplier is dominating a critical AI component these giants can’t build without. Click here to access our free report one of our favorites growth stories.
Operating Margin
Ryder has done a decent job managing its cost base over the last five years. The company has produced an average operating margin of 8.2%, higher than the broader industrials sector.
Analyzing the trend in its profitability, Ryder’s operating margin rose by 1.8 percentage points over the last five years, as its sales growth gave it operating leverage. Its expansion was impressive, especially when considering most Ground Transportation peers saw their margins plummet.
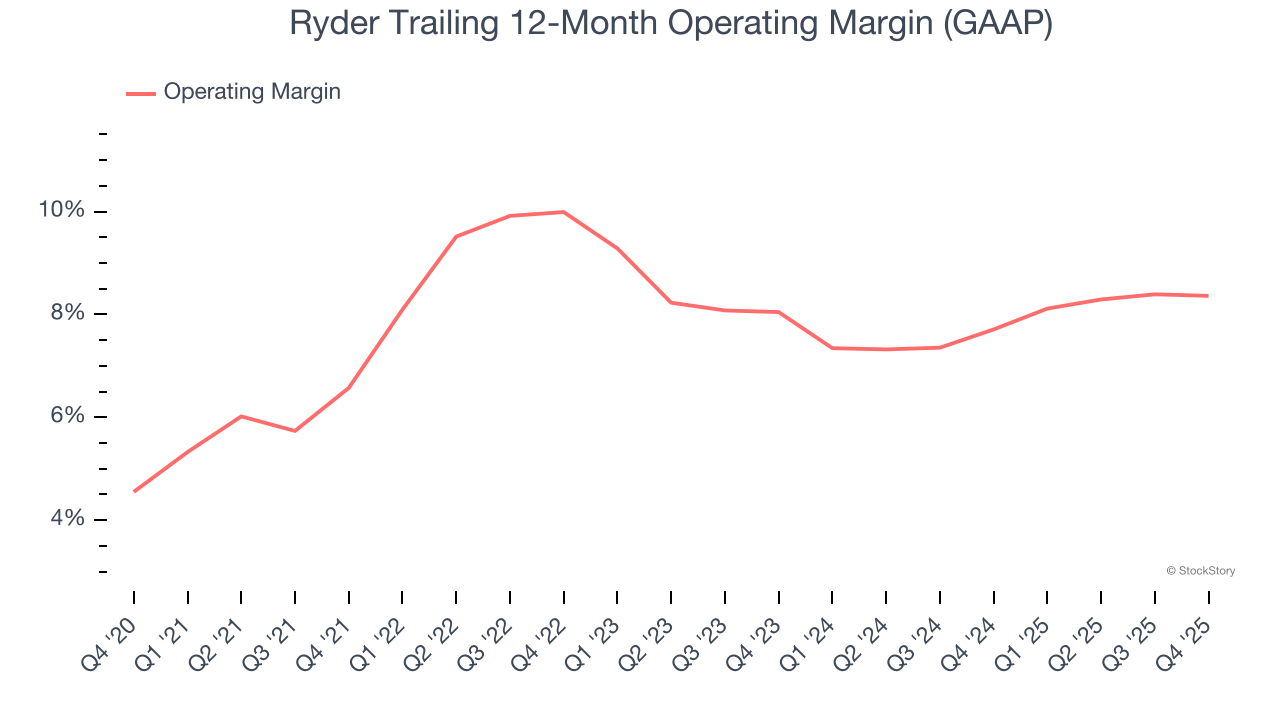
This quarter, Ryder generated an operating margin profit margin of 8.8%, in line with the same quarter last year. This indicates the company’s cost structure has recently been stable.
Earnings Per Share
Revenue trends explain a company’s historical growth, but the long-term change in earnings per share (EPS) points to the profitability of that growth – for example, a company could inflate its sales through excessive spending on advertising and promotions.
Ryder’s full-year EPS flipped from negative to positive over the last five years. This is encouraging and shows it’s at a critical moment in its life.
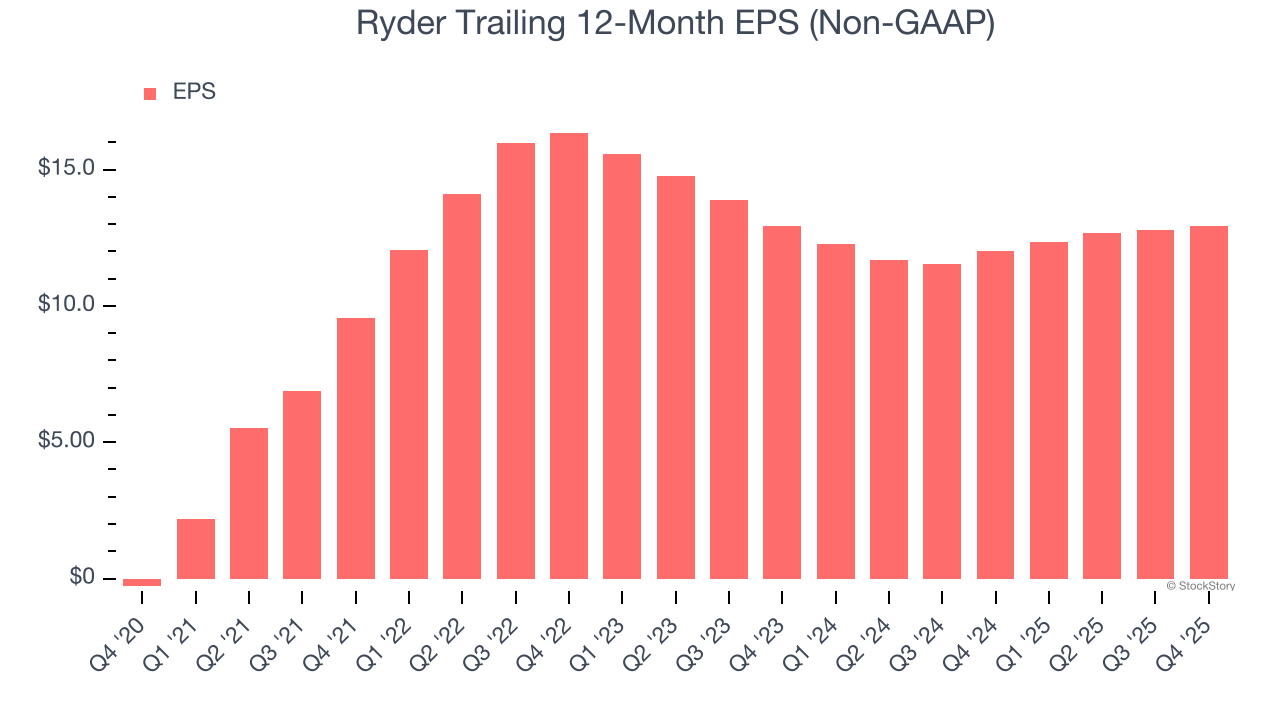
Like with revenue, we analyze EPS over a more recent period because it can provide insight into an emerging theme or development for the business.
Ryder’s flat EPS over the last two years was worse than its 3.7% annualized revenue growth. This tells us the company became less profitable on a per-share basis as it expanded.
In Q4, Ryder reported adjusted EPS of $3.59, up from $3.45 in the same quarter last year. This print was close to analysts’ estimates. Over the next 12 months, Wall Street expects Ryder’s full-year EPS of $12.94 to grow 12.9%.
Key Takeaways from Ryder’s Q4 Results
We struggled to find many positives in these results. Its full-year EPS guidance missed and its EPS guidance for next quarter fell short of Wall Street’s estimates. Overall, this was a softer quarter. The stock traded down 3.6% to $204.50 immediately following the results.
Ryder underperformed this quarter, but does that create an opportunity to invest right now? If you’re making that decision, you should consider the bigger picture of valuation, business qualities, as well as the latest earnings. We cover that in our actionable full research report which you can read here (it’s free).


