
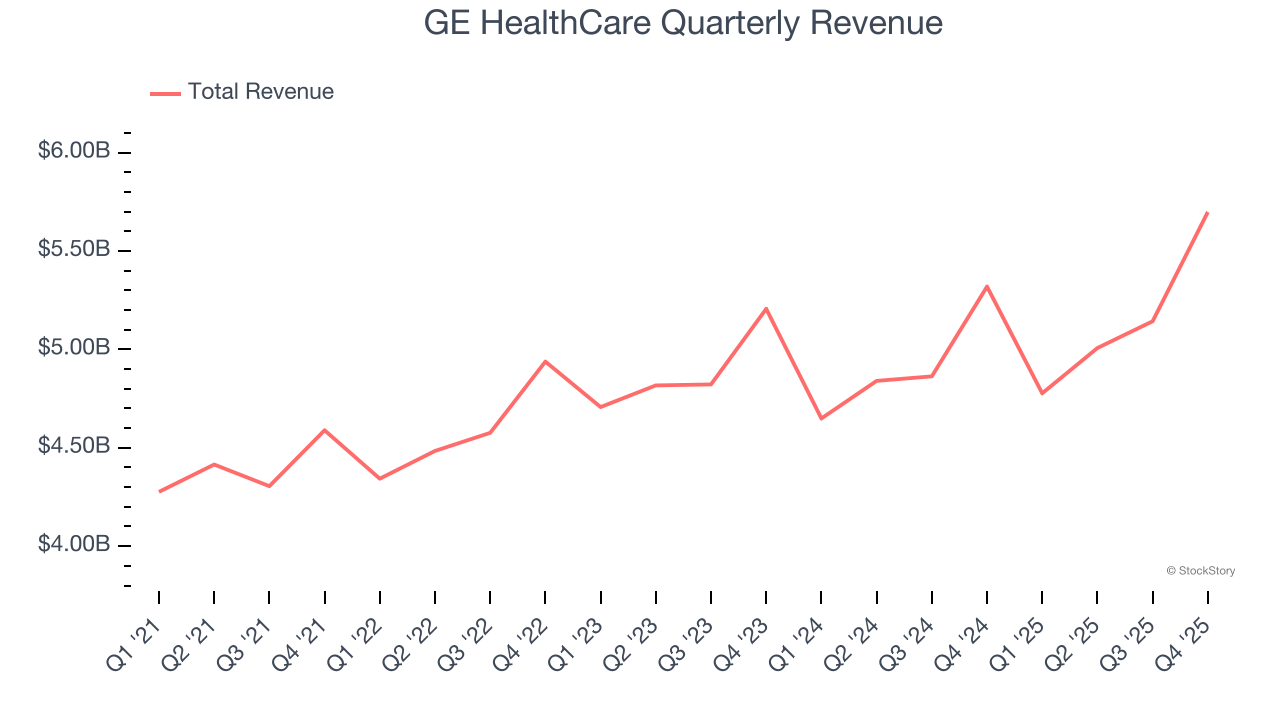
Healthcare technology company GE HealthCare Technologies (NASDAQ: GEHC) reported Q4 CY2025 results exceeding the market’s revenue expectations, with sales up 7.1% year on year to $5.70 billion. Its non-GAAP profit of $1.44 per share was 3% above analysts’ consensus estimates.
Is now the time to buy GE HealthCare? Find out by accessing our full research report, it’s free.
GE HealthCare (GEHC) Q4 CY2025 Highlights:
- Revenue: $5.70 billion vs analyst estimates of $5.60 billion (7.1% year-on-year growth, 1.7% beat)
- Adjusted EPS: $1.44 vs analyst estimates of $1.40 (3% beat)
- Adjusted EPS guidance for the upcoming financial year 2026 is $5.05 at the midpoint, beating analyst estimates by 2.5%
- Operating Margin: 14.5%, in line with the same quarter last year
- Free Cash Flow Margin: 16.1%, similar to the same quarter last year
- Organic Revenue rose 4.8% year on year (beat)
- Market Capitalization: $35.89 billion
GE HealthCare President and CEO Peter Arduini said, “In our third year as a public company, we’ve made great strides executing our strategy focused on precision care, growth acceleration, and business optimization. We delivered a strong quarter and year with growth in Pharmaceutical Diagnostics, Imaging, and Advanced Visualization Solutions. This reflects healthy capital investment trends, commercial execution and demand for new products.
Company Overview
Spun off from industrial giant General Electric in 2023 after over a century as its healthcare division, GE HealthCare (NASDAQ: GEHC) provides medical imaging equipment, patient monitoring systems, diagnostic pharmaceuticals, and AI-enabled healthcare solutions to hospitals and clinics worldwide.
Revenue Growth
A company’s long-term sales performance can indicate its overall quality. Any business can have short-term success, but a top-tier one grows for years. Unfortunately, GE HealthCare’s 4.1% annualized revenue growth over the last four years was mediocre. This fell short of our benchmark for the healthcare sector and is a rough starting point for our analysis.
Long-term growth is the most important, but within healthcare, a stretched historical view may miss new innovations or demand cycles. GE HealthCare’s recent performance shows its demand has slowed as its annualized revenue growth of 2.7% over the last two years was below its four-year trend. 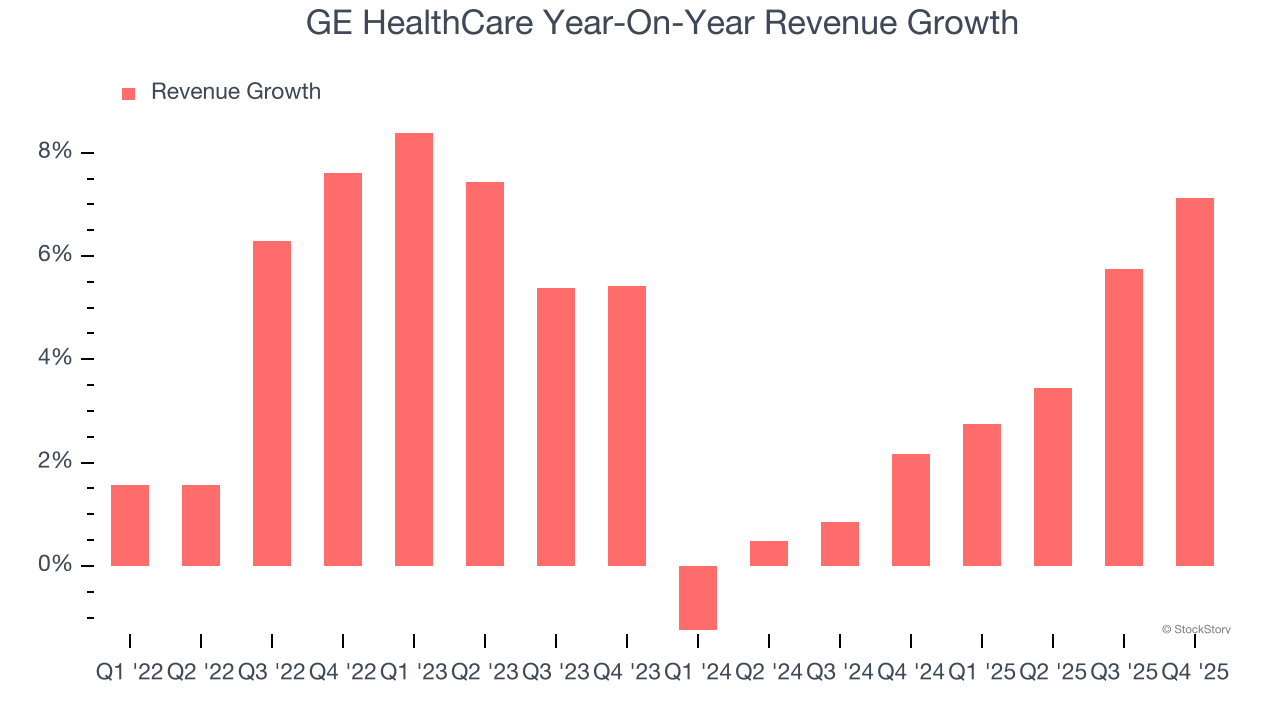
We can dig further into the company’s sales dynamics by analyzing its organic revenue, which strips out one-time events like acquisitions and currency fluctuations that don’t accurately reflect its fundamentals. Over the last two years, GE HealthCare’s organic revenue averaged 2.2% year-on-year growth. Because this number aligns with its two-year revenue growth, we can see the company’s core operations (not acquisitions and divestitures) drove most of its results. 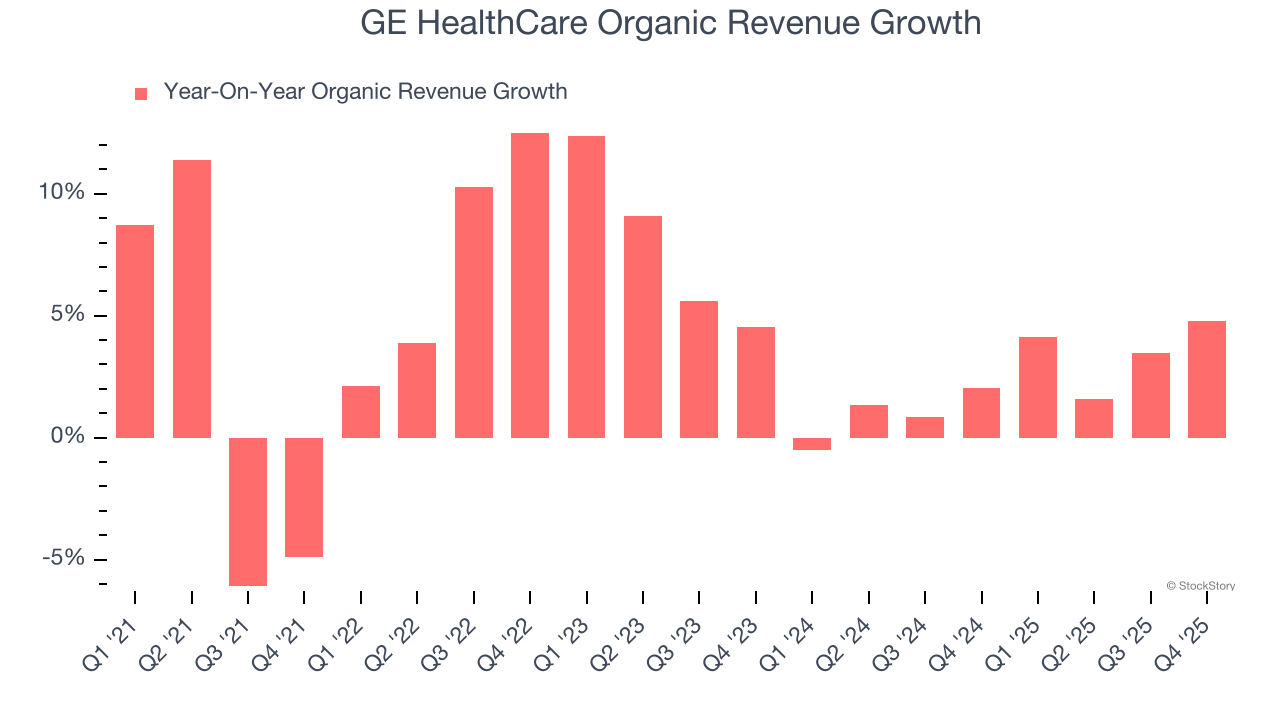
This quarter, GE HealthCare reported year-on-year revenue growth of 7.1%, and its $5.70 billion of revenue exceeded Wall Street’s estimates by 1.7%.
Looking ahead, sell-side analysts expect revenue to grow 3.8% over the next 12 months, similar to its two-year rate. While this projection implies its newer products and services will catalyze better top-line performance, it is still below average for the sector.
Microsoft, Alphabet, Coca-Cola, Monster Beverage—all began as under-the-radar growth stories riding a massive trend. We’ve identified the next one: a profitable AI semiconductor play Wall Street is still overlooking. Go here for access to our full report.
Operating Margin
Operating margin is one of the best measures of profitability because it tells us how much money a company takes home after subtracting all core expenses, like marketing and R&D.
GE HealthCare has done a decent job managing its cost base over the last five years. The company has produced an average operating margin of 13.7%, higher than the broader healthcare sector.
Analyzing the trend in its profitability, GE HealthCare’s operating margin decreased by 2.5 percentage points over the last five years. This raises questions about the company’s expense base because its revenue growth should have given it leverage on its fixed costs, resulting in better economies of scale and profitability.
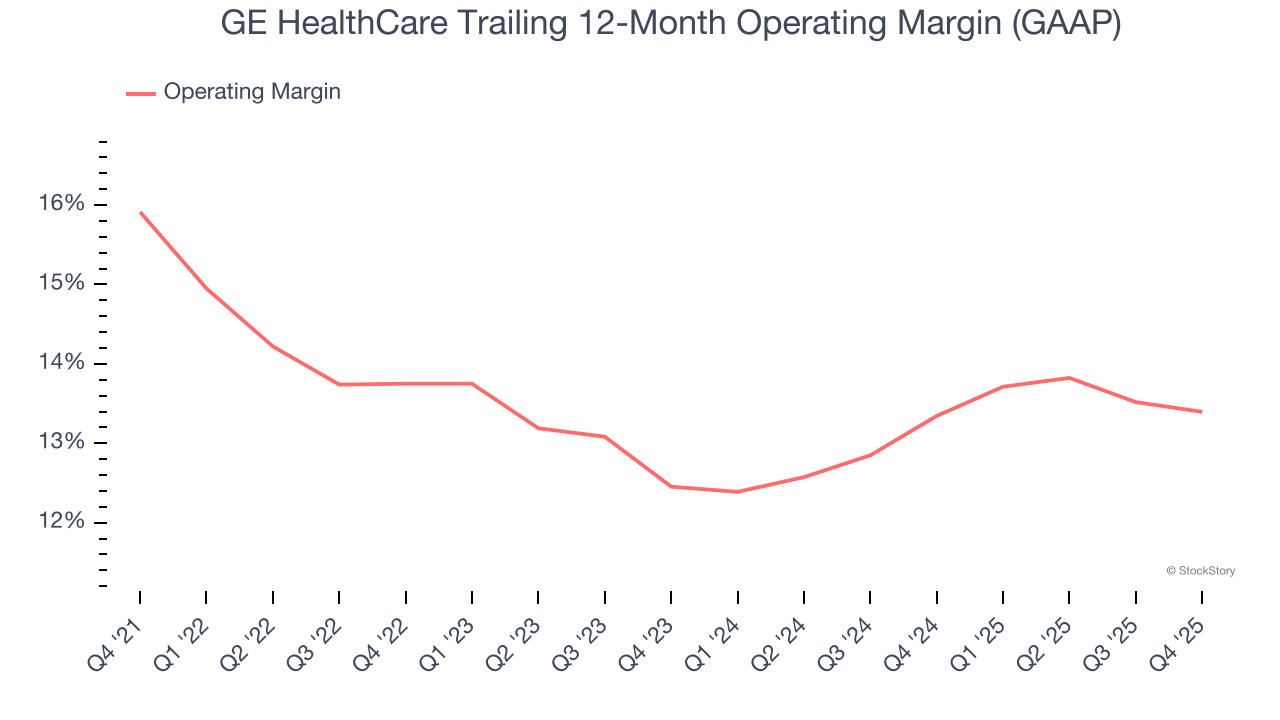
This quarter, GE HealthCare generated an operating margin profit margin of 14.5%, in line with the same quarter last year. This indicates the company’s overall cost structure has been relatively stable.
Earnings Per Share
Revenue trends explain a company’s historical growth, but the long-term change in earnings per share (EPS) points to the profitability of that growth – for example, a company could inflate its sales through excessive spending on advertising and promotions.
Sadly for GE HealthCare, its EPS declined by 2.3% annually over the last four years while its revenue grew by 4.1%. This tells us the company became less profitable on a per-share basis as it expanded due to non-fundamental factors such as interest expenses and taxes.
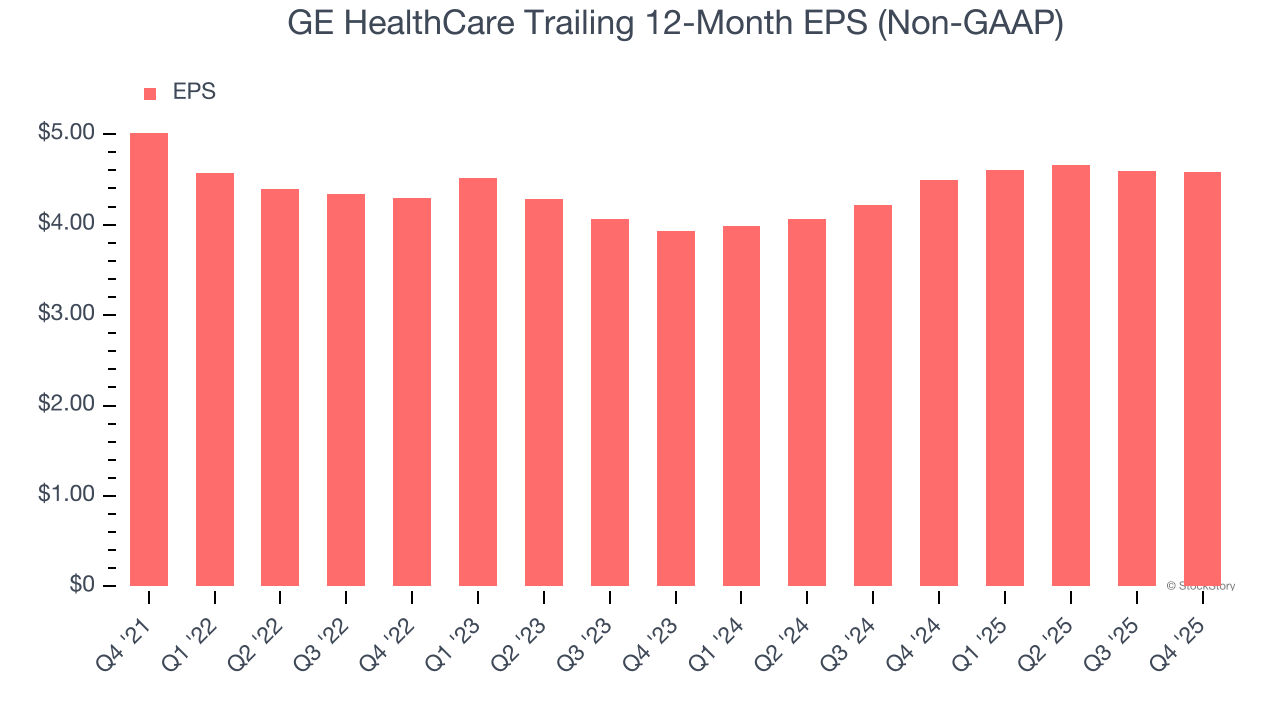
In Q4, GE HealthCare reported adjusted EPS of $1.44, down from $1.45 in the same quarter last year. Despite falling year on year, this print beat analysts’ estimates by 3%. Over the next 12 months, Wall Street expects GE HealthCare’s full-year EPS of $4.58 to grow 7.2%.
Key Takeaways from GE HealthCare’s Q4 Results
We enjoyed seeing GE HealthCare beat analysts’ full-year EPS guidance expectations this quarter. We were also happy its organic revenue narrowly outperformed Wall Street’s estimates. Overall, we think this was a solid quarter with some key areas of upside. The stock traded up 1.4% to $79.91 immediately after reporting.
GE HealthCare put up rock-solid earnings, but one quarter doesn’t necessarily make the stock a buy. Let’s see if this is a good investment. What happened in the latest quarter matters, but not as much as longer-term business quality and valuation, when deciding whether to invest in this stock. We cover that in our actionable full research report which you can read here (it’s free).


