

Manufacturing company Stanley Black & Decker (NYSE: SWK) missed Wall Street’s revenue expectations in Q4 CY2025, with sales flat year on year at $3.68 billion. Its non-GAAP profit of $1.41 per share was 9.9% above analysts’ consensus estimates.
Is now the time to buy Stanley Black & Decker? Find out by accessing our full research report, it’s free.
Stanley Black & Decker (SWK) Q4 CY2025 Highlights:
- Revenue: $3.68 billion vs analyst estimates of $3.77 billion (flat year on year, 2.2% miss)
- Adjusted EPS: $1.41 vs analyst estimates of $1.28 (9.9% beat)
- Adjusted EBITDA: $497.3 million vs analyst estimates of $487.8 million (13.5% margin, 1.9% beat)
- Adjusted EPS guidance for the upcoming financial year 2026 is $5.30 at the midpoint, missing analyst estimates by 5.7%
- Operating Margin: 8.4%, in line with the same quarter last year
- Free Cash Flow Margin: 24%, up from 15.2% in the same quarter last year
- Organic Revenue fell 3% year on year (miss)
- Market Capitalization: $12.54 billion
Chris Nelson, Stanley Black & Decker's President & CEO, commented, "Stanley Black & Decker delivered solid results across our key focus areas in 2025, with continued gross margin and net income growth, strong free cash flow*, a strengthened balance sheet, and strategic investments focused on driving sustainable, profitable growth. I would like to thank our team for their resilience and commitment to serving our customers and achieving these results despite the dynamic environment.
Company Overview
With an iconic “STANLEY” logo which has remained virtually unchanged for over a century, Stanley Black & Decker (NYSE: SWK) is a manufacturer primarily catering to the tool and outdoor equipment industry.
Revenue Growth
A company’s long-term performance is an indicator of its overall quality. Any business can have short-term success, but a top-tier one grows for years. Unfortunately, Stanley Black & Decker’s 3% annualized revenue growth over the last five years was sluggish. This fell short of our benchmarks and is a poor baseline for our analysis.
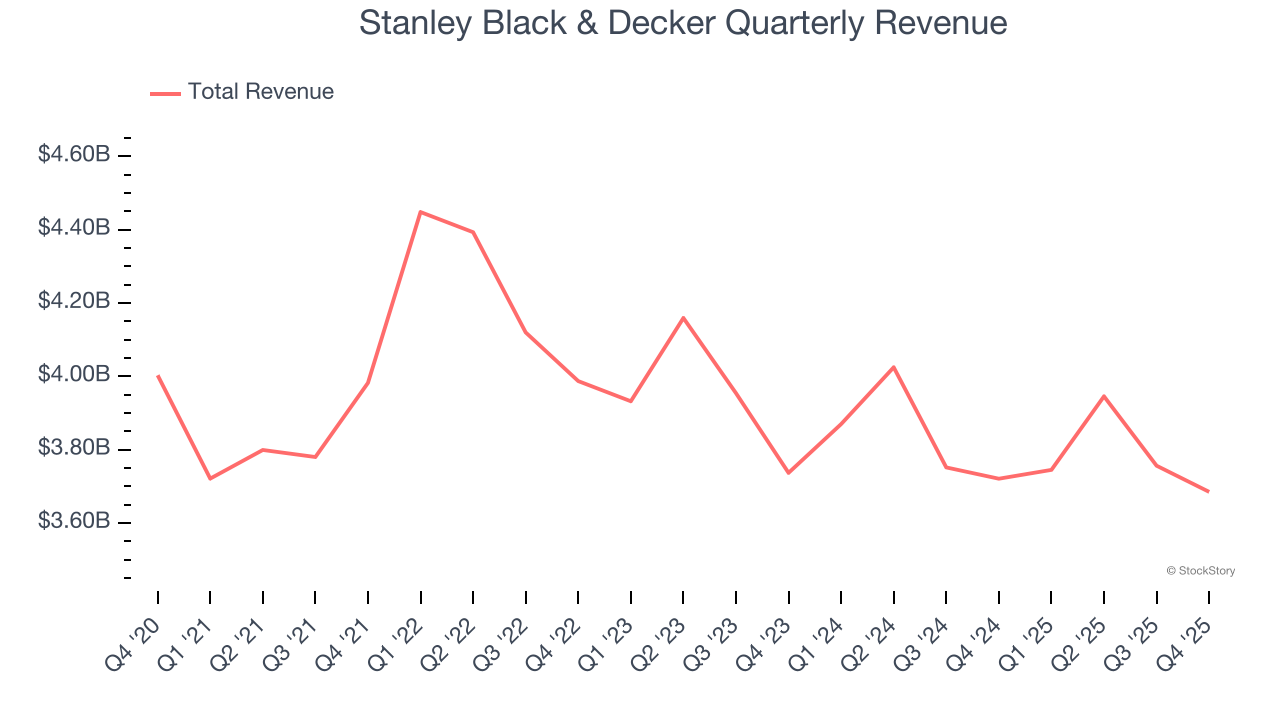
Long-term growth is the most important, but within industrials, a half-decade historical view may miss new industry trends or demand cycles. Stanley Black & Decker’s performance shows it grew in the past but relinquished its gains over the last two years, as its revenue fell by 2.1% annually. 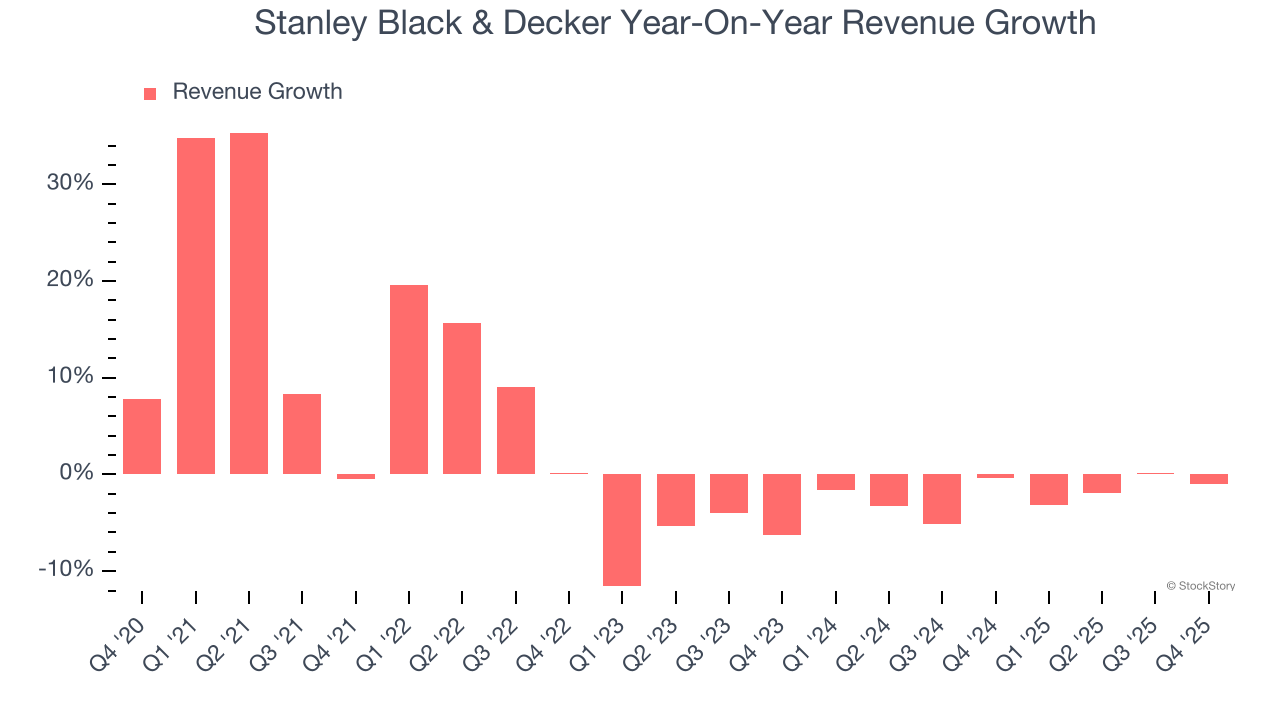
We can better understand the company’s sales dynamics by analyzing its organic revenue, which strips out one-time events like acquisitions and currency fluctuations that don’t accurately reflect its fundamentals. Over the last two years, Stanley Black & Decker’s organic revenue was flat. Because this number aligns with its two-year revenue growth, we can see the company’s core operations (not acquisitions and divestitures) drove most of its results. 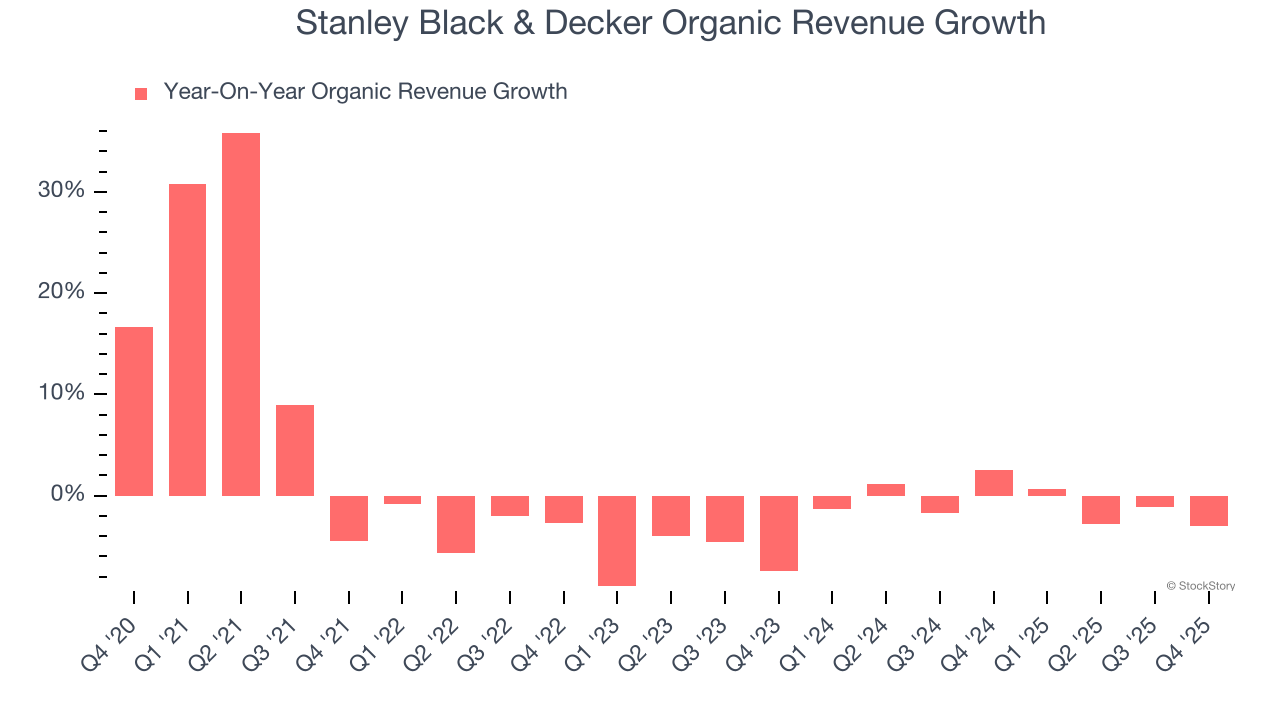
This quarter, Stanley Black & Decker missed Wall Street’s estimates and reported a rather uninspiring 1% year-on-year revenue decline, generating $3.68 billion of revenue.
Looking ahead, sell-side analysts expect revenue to grow 3% over the next 12 months. While this projection indicates its newer products and services will spur better top-line performance, it is still below average for the sector.
Microsoft, Alphabet, Coca-Cola, Monster Beverage—all began as under-the-radar growth stories riding a massive trend. We’ve identified the next one: a profitable AI semiconductor play Wall Street is still overlooking. Go here for access to our full report.
Operating Margin
Operating margin is an important measure of profitability as it shows the portion of revenue left after accounting for all core expenses – everything from the cost of goods sold to advertising and wages. It’s also useful for comparing profitability across companies with different levels of debt and tax rates because it excludes interest and taxes.
Stanley Black & Decker was profitable over the last five years but held back by its large cost base. Its average operating margin of 7.4% was weak for an industrials business. This result isn’t too surprising given its low gross margin as a starting point.
Looking at the trend in its profitability, Stanley Black & Decker’s operating margin decreased by 4.9 percentage points over the last five years. This raises questions about the company’s expense base because its revenue growth should have given it leverage on its fixed costs, resulting in better economies of scale and profitability. Stanley Black & Decker’s performance was poor no matter how you look at it - it shows that costs were rising and it couldn’t pass them onto its customers.
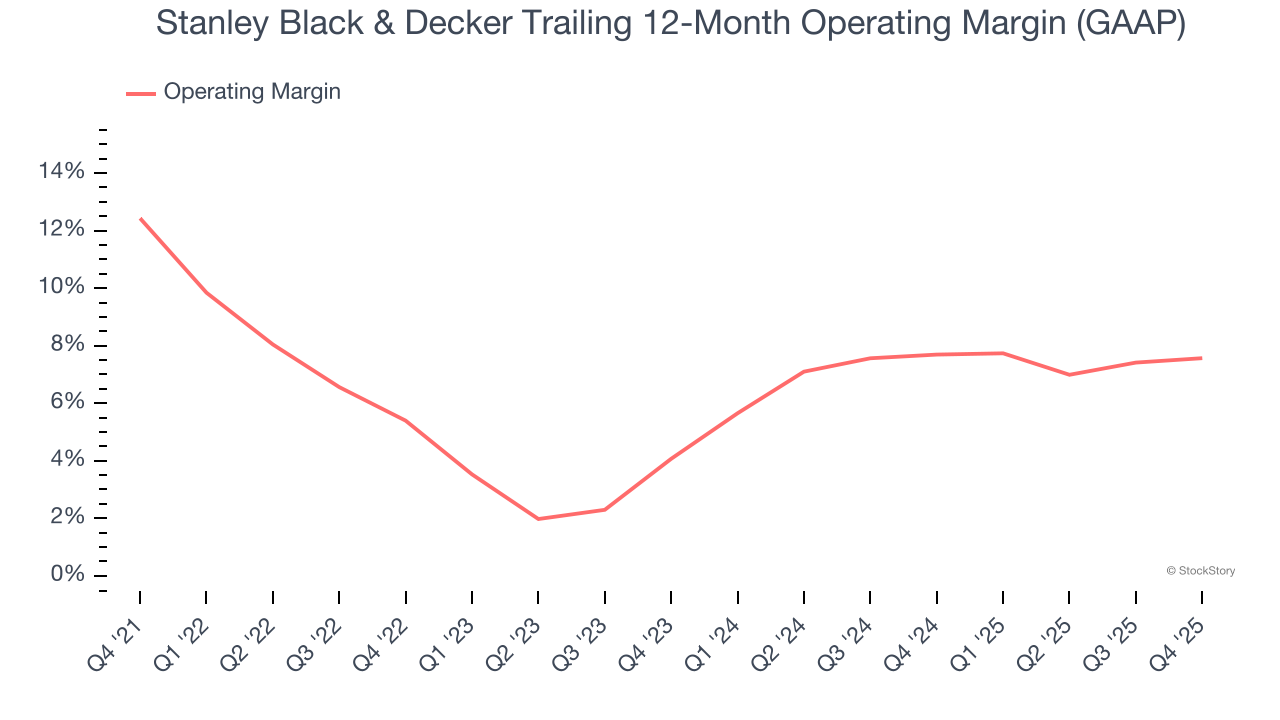
In Q4, Stanley Black & Decker generated an operating margin profit margin of 8.4%, in line with the same quarter last year. This indicates the company’s cost structure has recently been stable.
Earnings Per Share
We track the long-term change in earnings per share (EPS) for the same reason as long-term revenue growth. Compared to revenue, however, EPS highlights whether a company’s growth is profitable.
Sadly for Stanley Black & Decker, its EPS declined by 12.3% annually over the last five years while its revenue grew by 3%. This tells us the company became less profitable on a per-share basis as it expanded due to non-fundamental factors such as interest expenses and taxes.
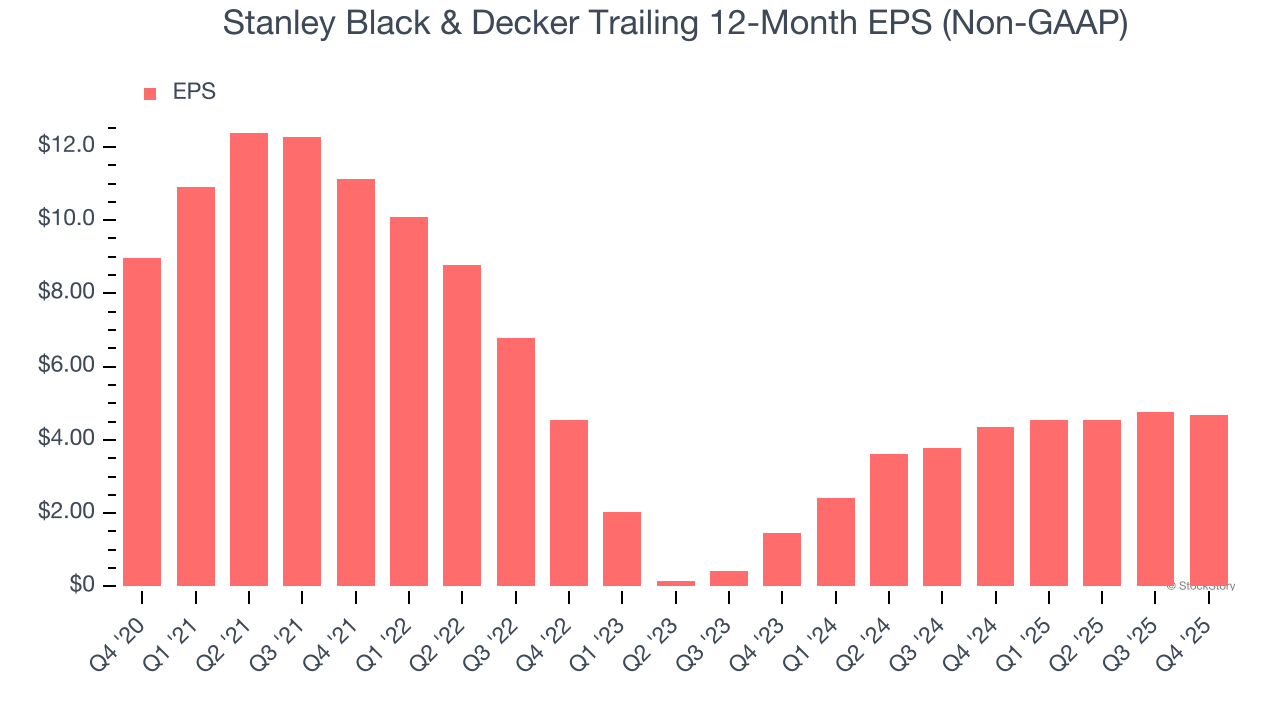
We can take a deeper look into Stanley Black & Decker’s earnings to better understand the drivers of its performance. As we mentioned earlier, Stanley Black & Decker’s operating margin was flat this quarter but declined by 4.9 percentage points over the last five years. This was the most relevant factor (aside from the revenue impact) behind its lower earnings; interest expenses and taxes can also affect EPS but don’t tell us as much about a company’s fundamentals.
Like with revenue, we analyze EPS over a more recent period because it can provide insight into an emerging theme or development for the business.
For Stanley Black & Decker, its two-year annual EPS growth of 79.5% was higher than its five-year trend. This acceleration made it one of the faster-growing industrials companies in recent history.
In Q4, Stanley Black & Decker reported adjusted EPS of $1.41, down from $1.49 in the same quarter last year. Despite falling year on year, this print beat analysts’ estimates by 9.9%. Over the next 12 months, Wall Street expects Stanley Black & Decker’s full-year EPS of $4.67 to grow 19%.
Key Takeaways from Stanley Black & Decker’s Q4 Results
It was good to see Stanley Black & Decker beat analysts’ EPS expectations this quarter. We were also happy its EBITDA outperformed Wall Street’s estimates. On the other hand, its full-year EPS guidance missed and its revenue fell short of Wall Street’s estimates. Overall, this quarter could have been better. The stock traded down 1.3% to $79.90 immediately following the results.
Stanley Black & Decker may have had a tough quarter, but does that actually create an opportunity to invest right now? What happened in the latest quarter matters, but not as much as longer-term business quality and valuation, when deciding whether to invest in this stock. We cover that in our actionable full research report which you can read here (it’s free).


