
Headquartered in Calgary, Canada, SNDL Inc. (SNDL) produces, distributes, and sells cannabis products under the four broad segments of Liquor Retail; Cannabis Retail; Cannabis Operations; and Investments.
The company enjoys significant investor attention, as evident from its position in the Robinhood top 100 list. Also, it has an average trading volume of 3.13 million. In terms of its forward EV/EBITDA, the stock is trading at 15.01x, 16.9% higher than the industry average of 12.85x.
The stock closed its last trading session at $1.42, lower than the 50-day moving average of $1.58 and 200-day moving average of $2.13. Moreover, its trailing-12-month gross profit margin of 18.89% is 66.1% lower than the 55.77% industry average.
Let’s look at the trends of its key financial metrics to understand why this could be best avoided now.
Analyzing SNDL's Net Income, Price/Sales Ratio, and Gross Margin
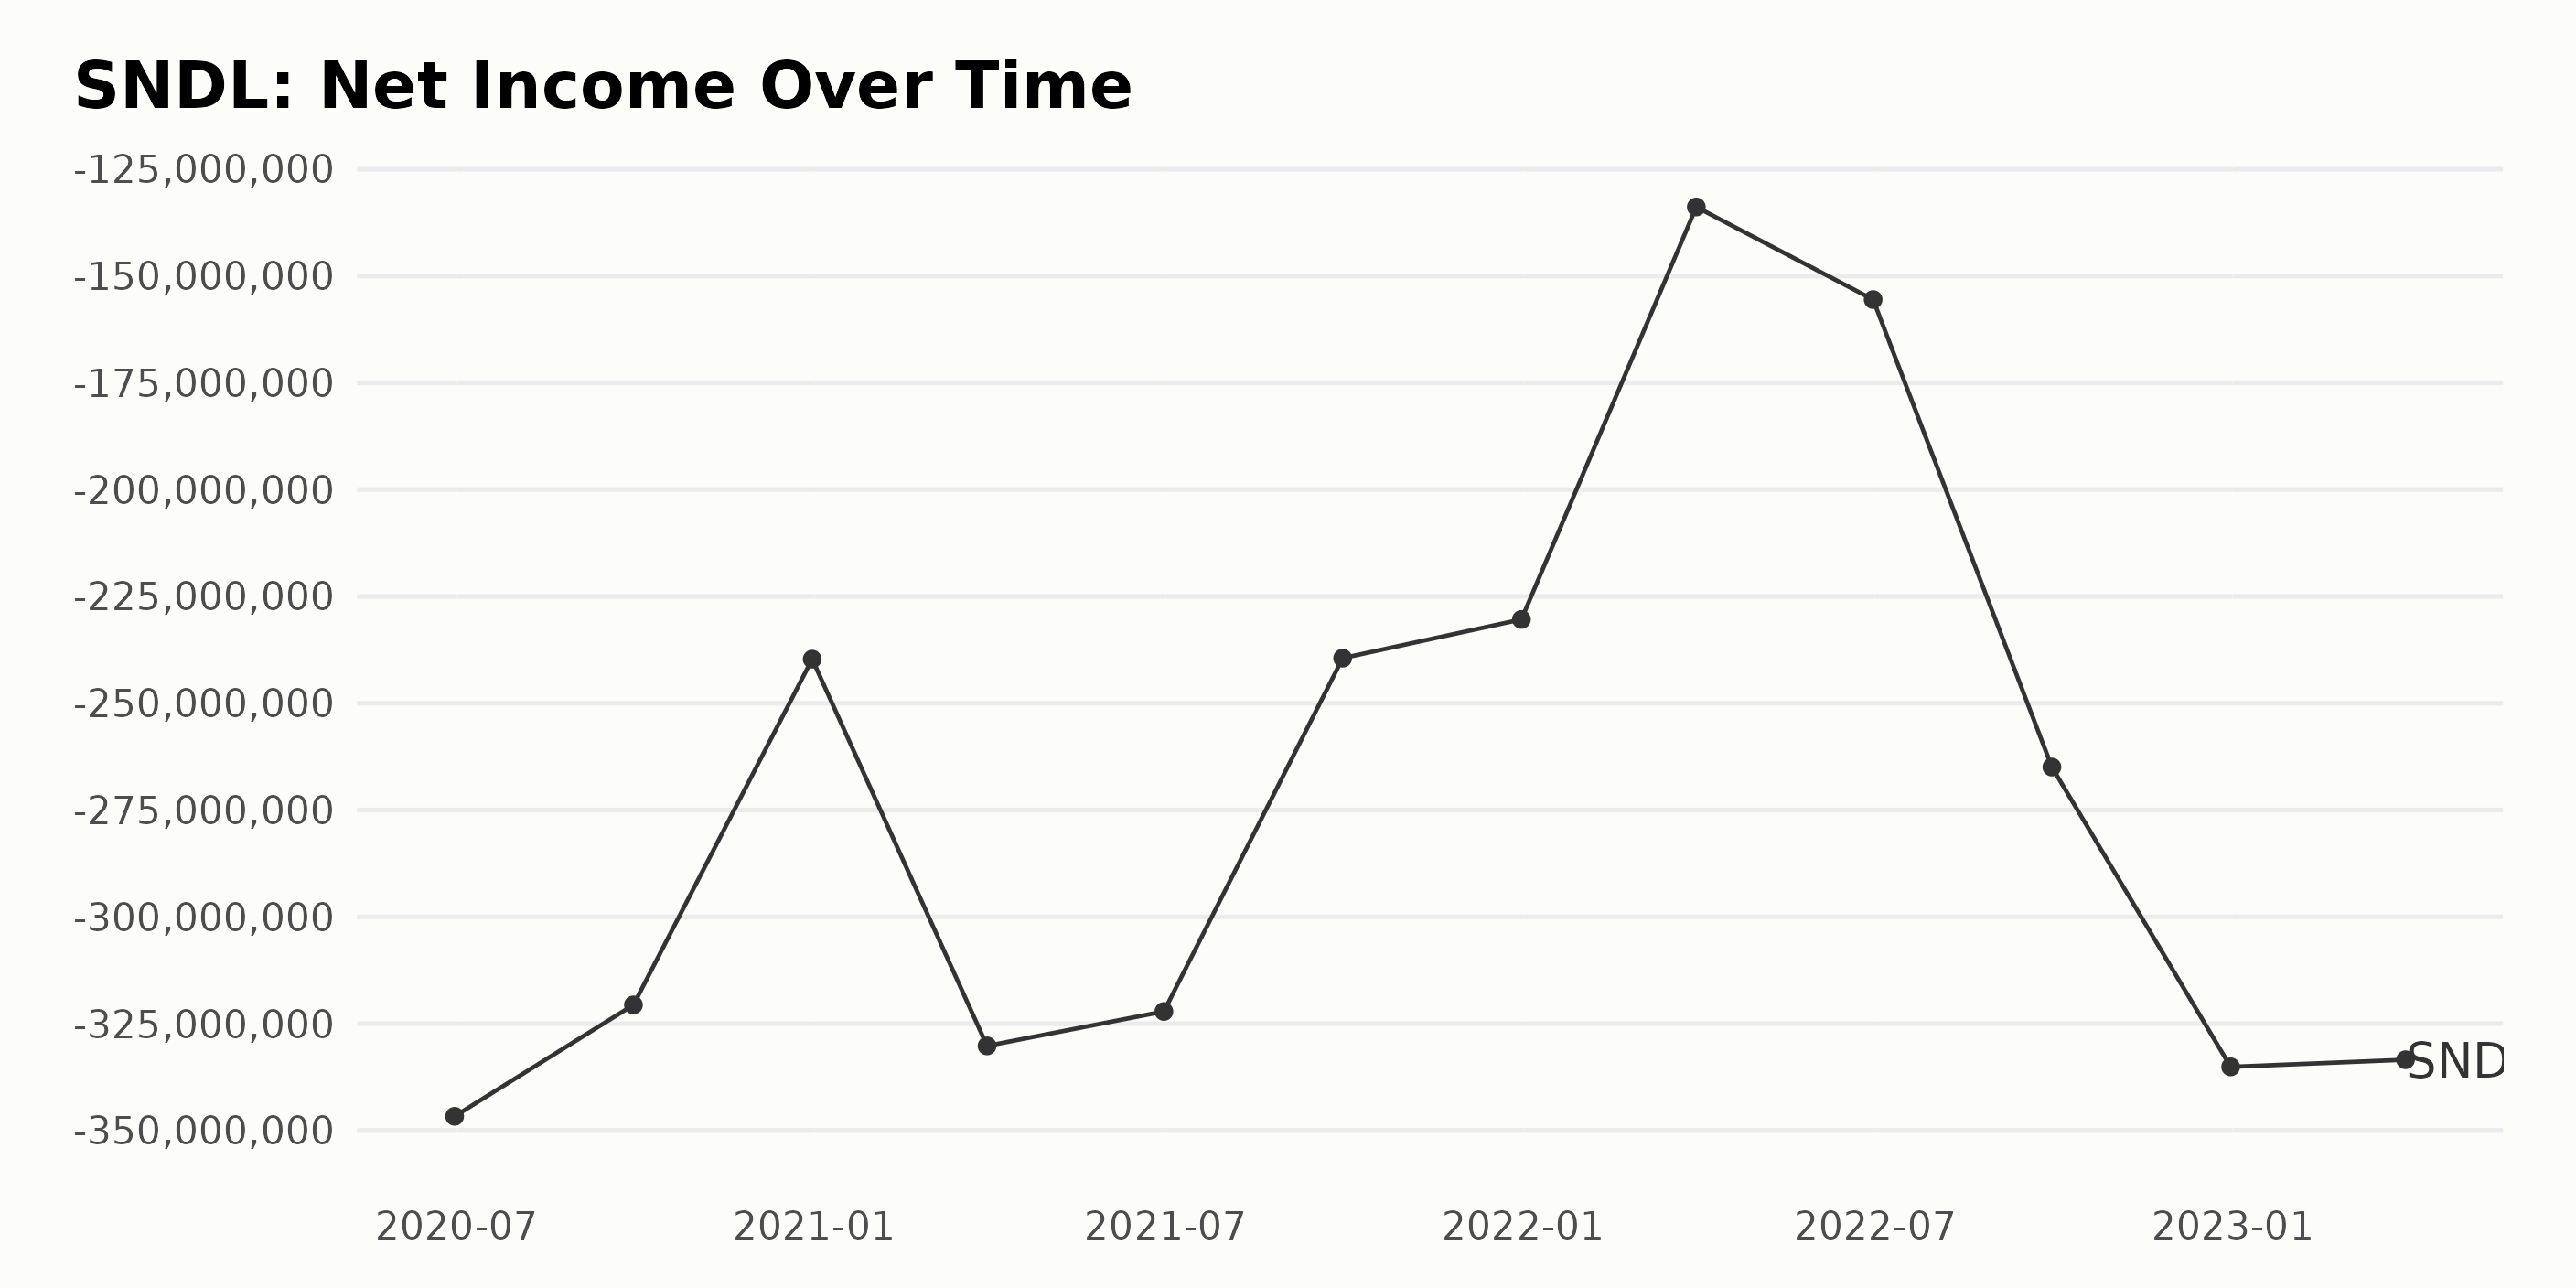
The series for SNDL's net income has shown fluctuations over the past two years, with an overall decreasing trend. The data has ranged from -$346.68 million (June 30, 2020) to -$335.51 million (December 31, 2022). From the beginning of the series to the last value, SNDL's net income has decreased by 4.5%.
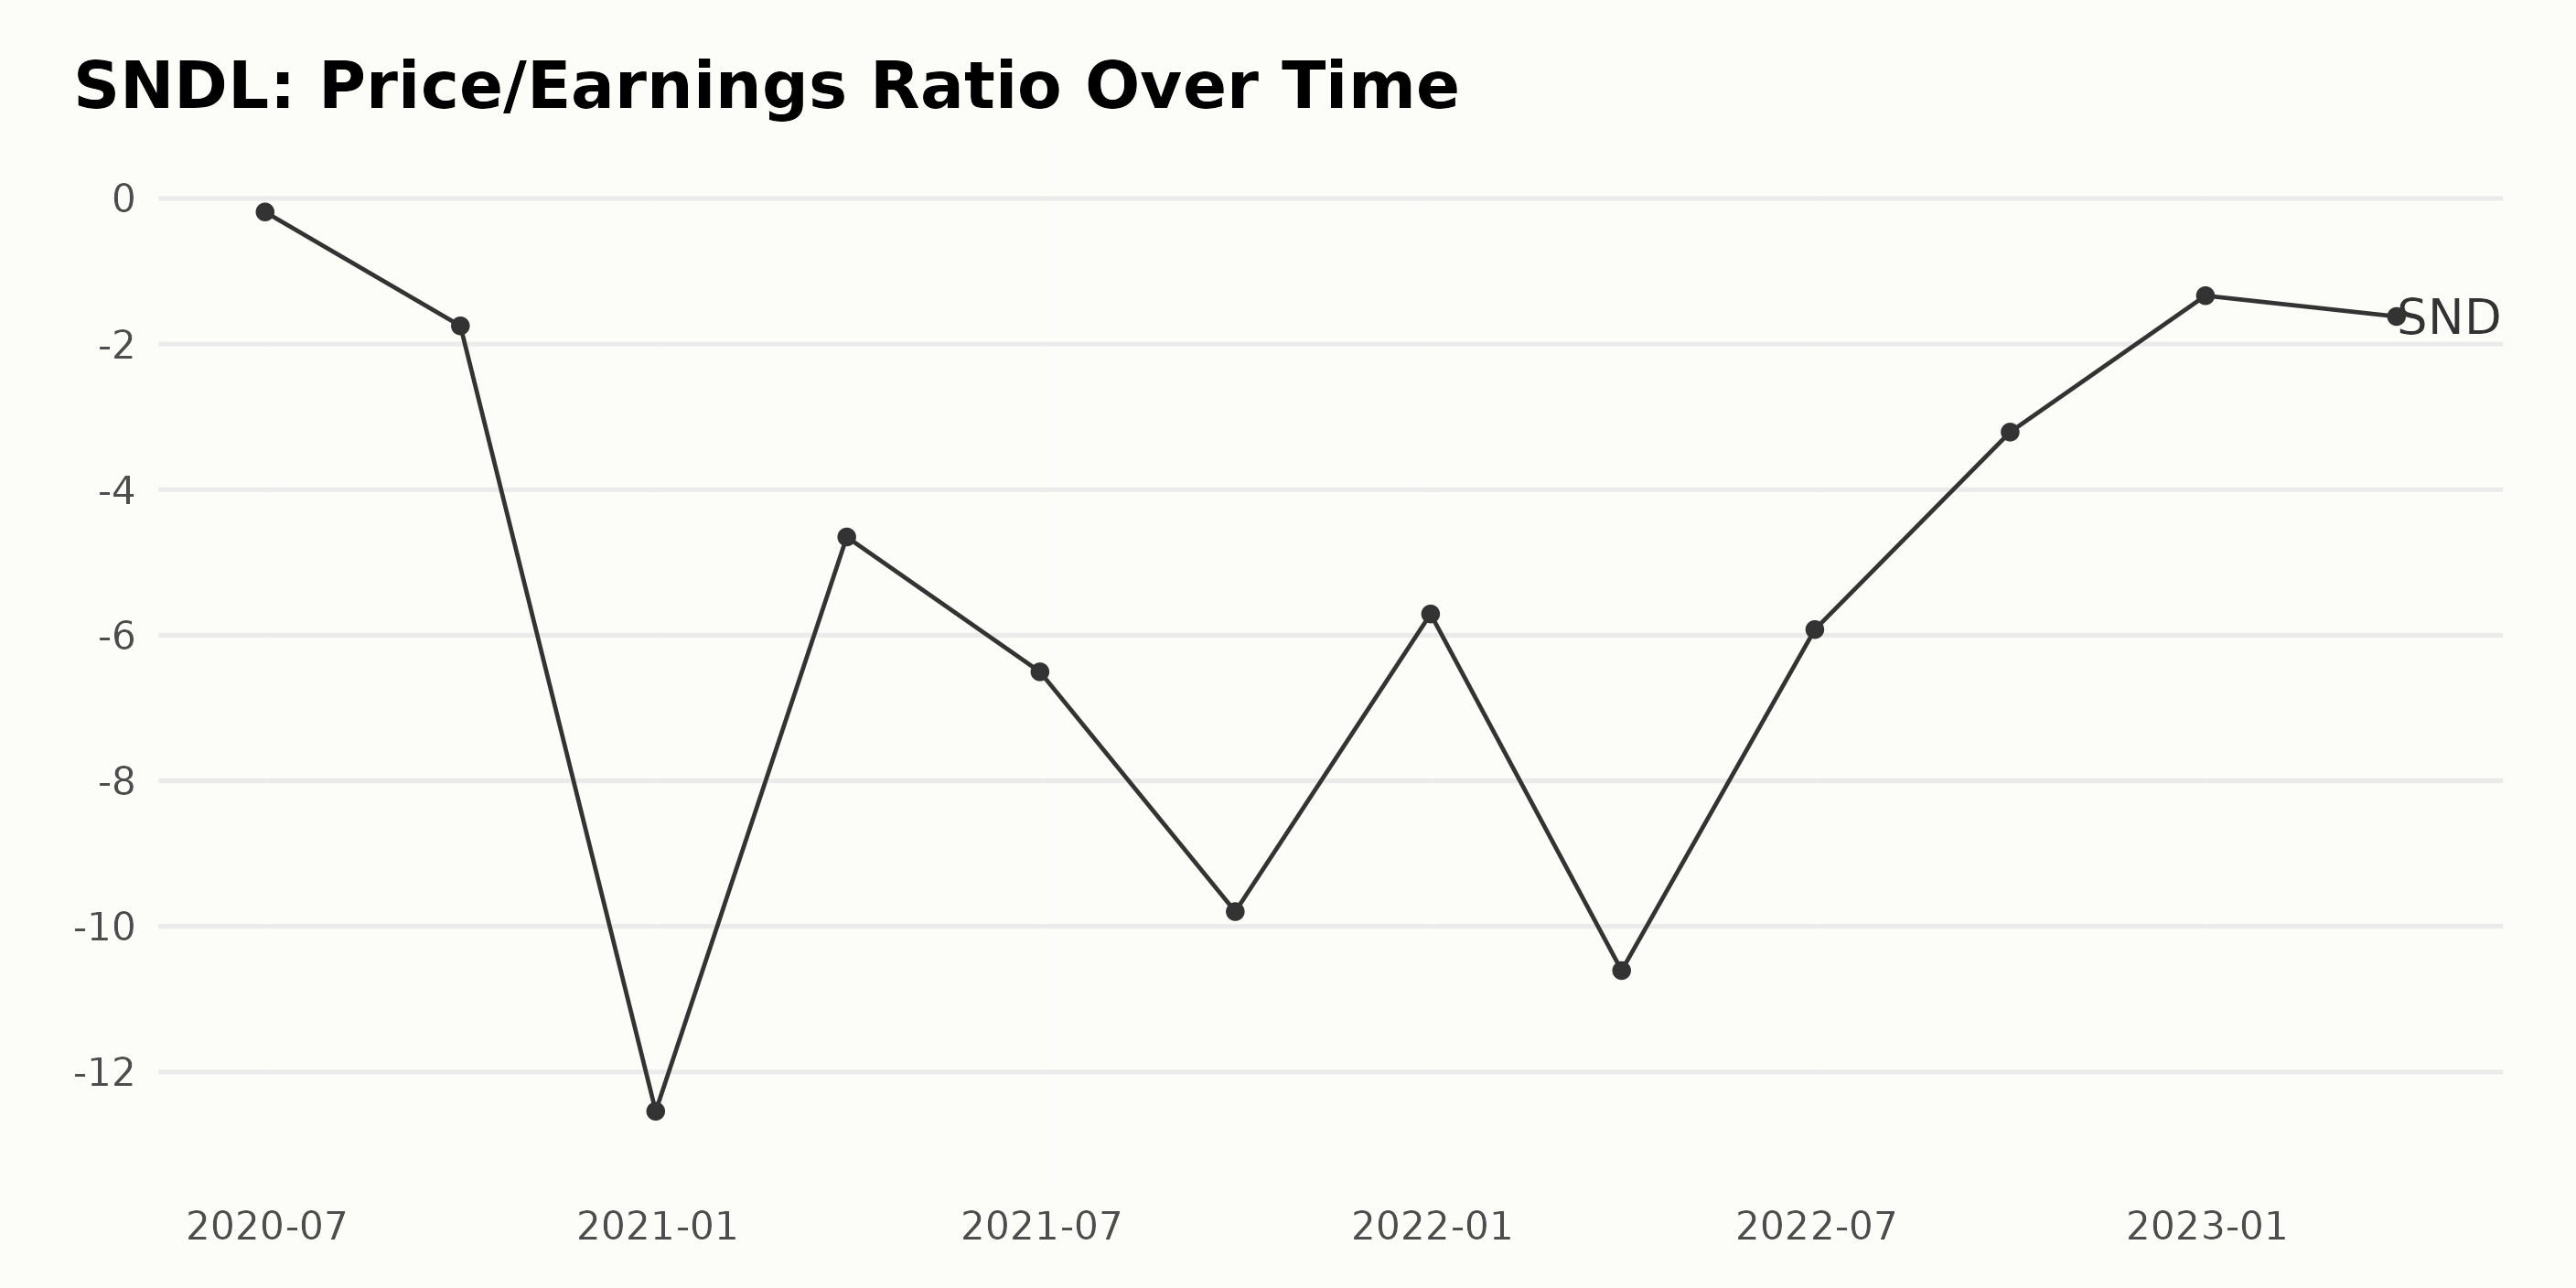
The trend of SNDL's Price/Earnings (P/E) ratio has been downward, with a growth rate of -83.3% from June 30, 2020, to March 31, 2023. There have been fluctuations over the past two and a half years, with the P/E ratio dropping as low as -12.5 on December 31, 2020, before increasing again to -1.6 on March 31, 2023.
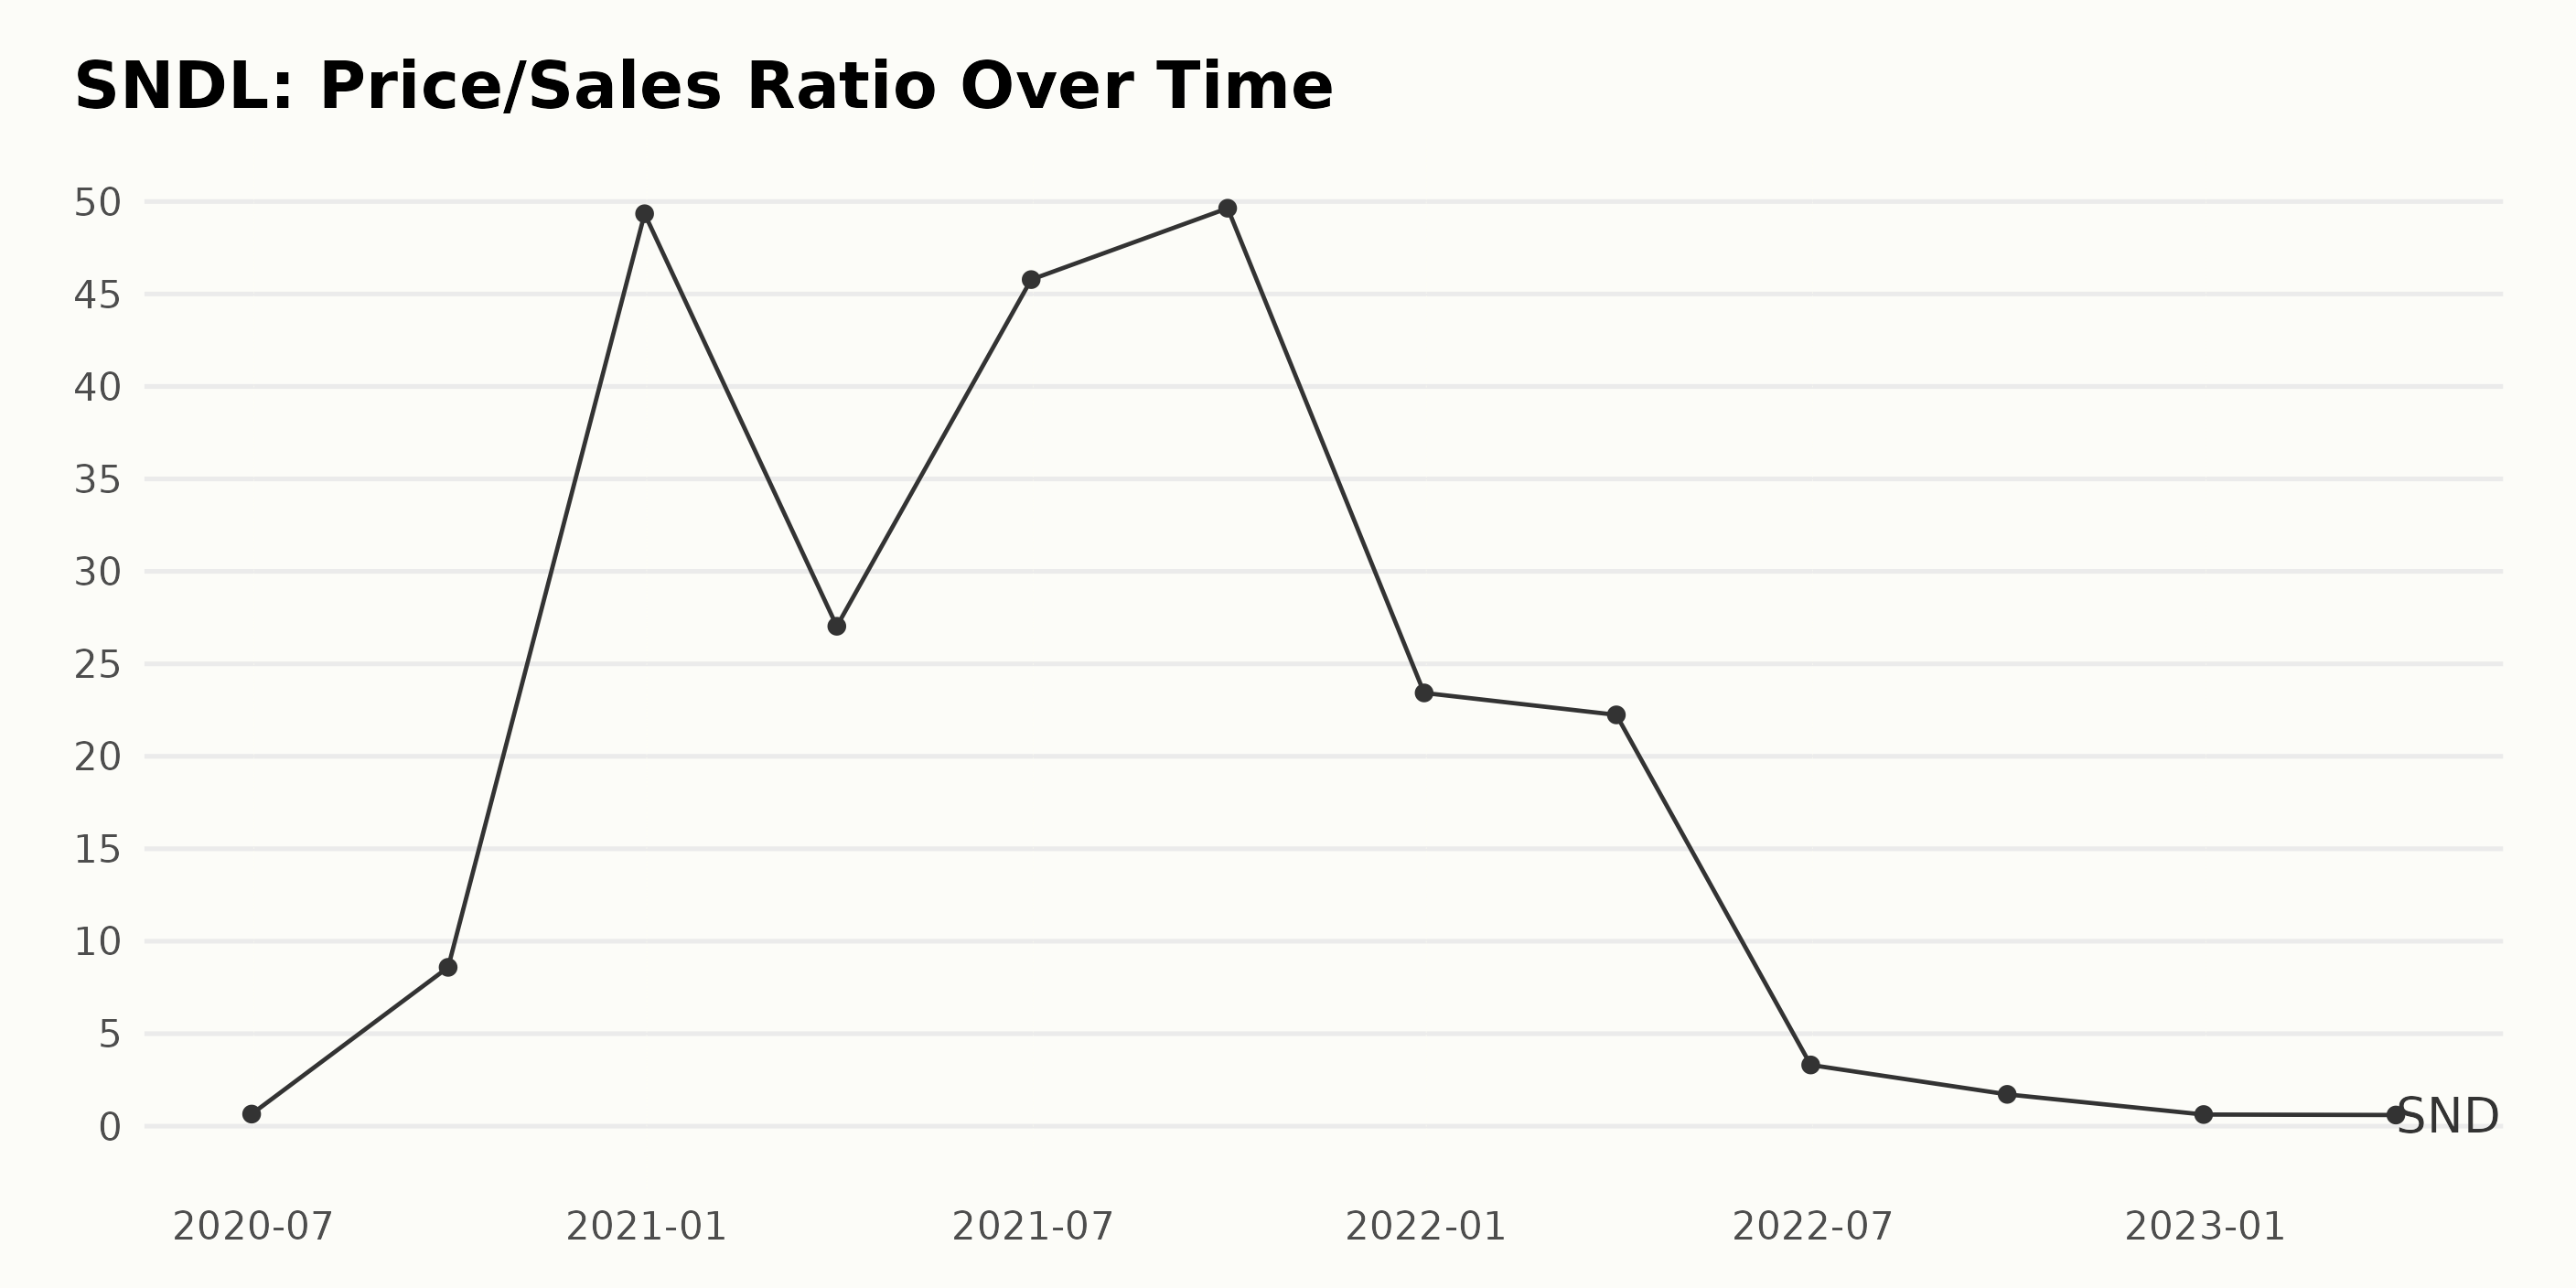
The Price/Sales Ratio (P/S) of SNDL has displayed volatile fluctuations over the past few years. From June 30, 2020, to March 31, 2023, the P/S increased by more than seven-hundred fold from 0.653 to 45.778.
The last value reported in the series on March 31, 2023, was 0.603, a 3% decrease from the previous value on December 31, 2022. The overall growth rate of the P/S from the start of the series on June 30, 2020, to March 31, 2023, was 6,581%.
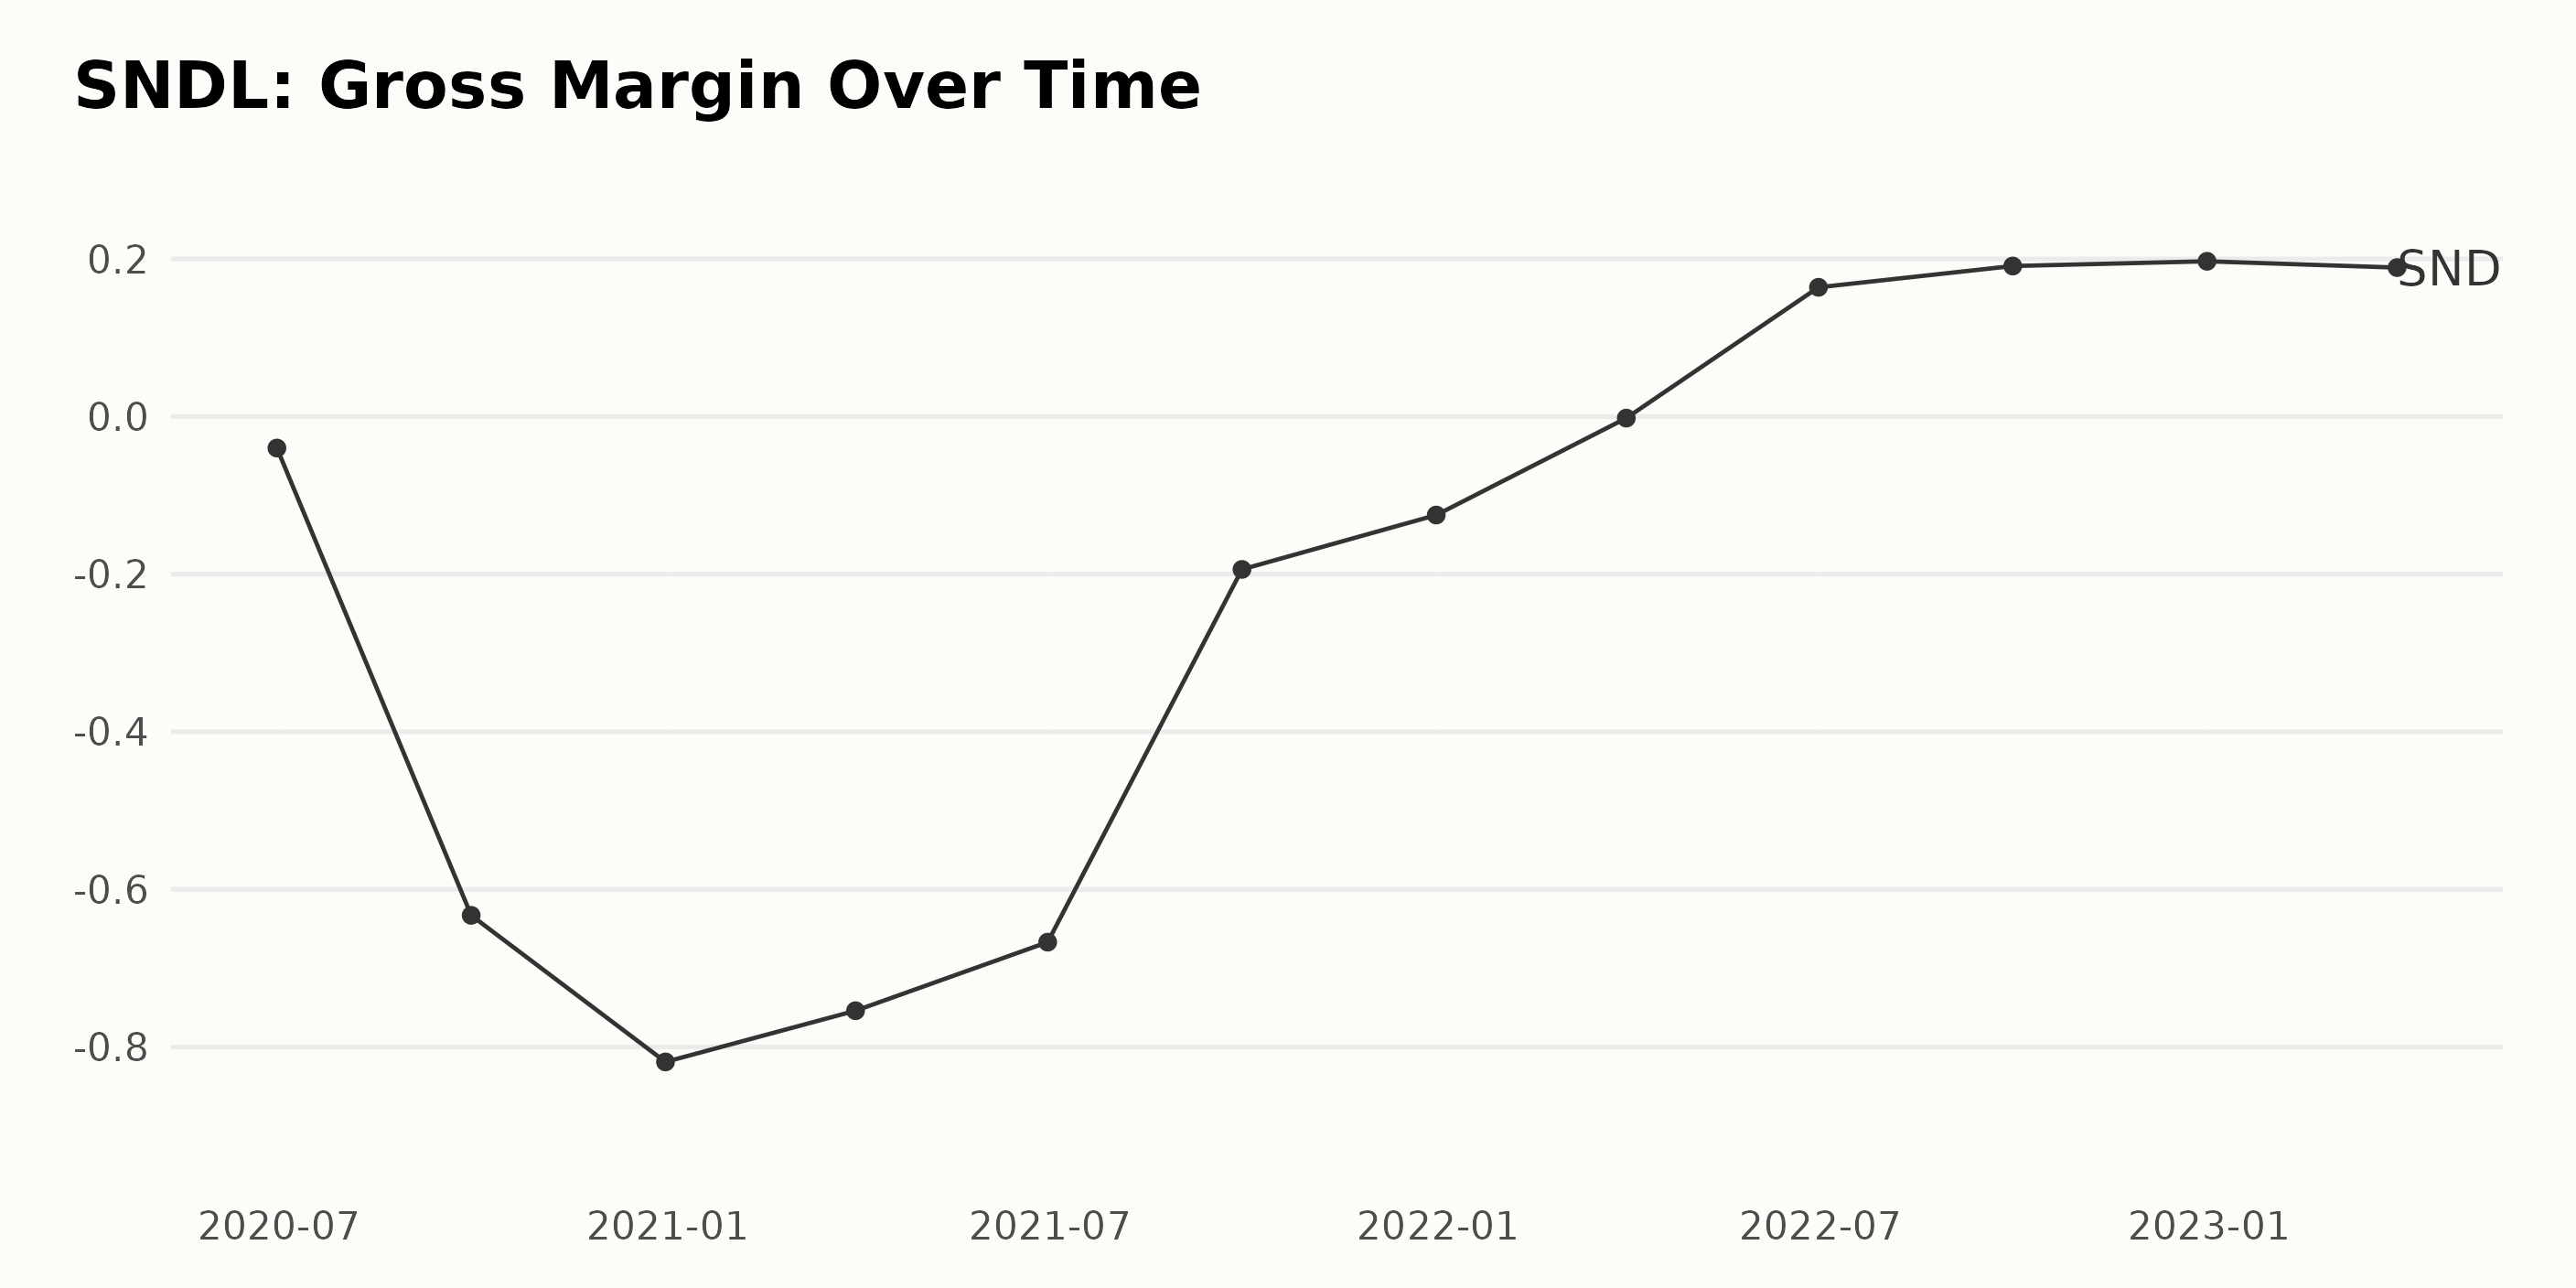
The gross margin of SNDL showed a generally declining trend with fluctuations over the past two years. In June 2020, the gross margin was -4.0% and decreased to -19.4% in September 2021. The most recent data for March 2023 shows a gross margin of 18.9%, representing a growth of 1,914% compared to the iconic low of -19.4% in September 2021.
Sharp Drop in SNDL Share Price
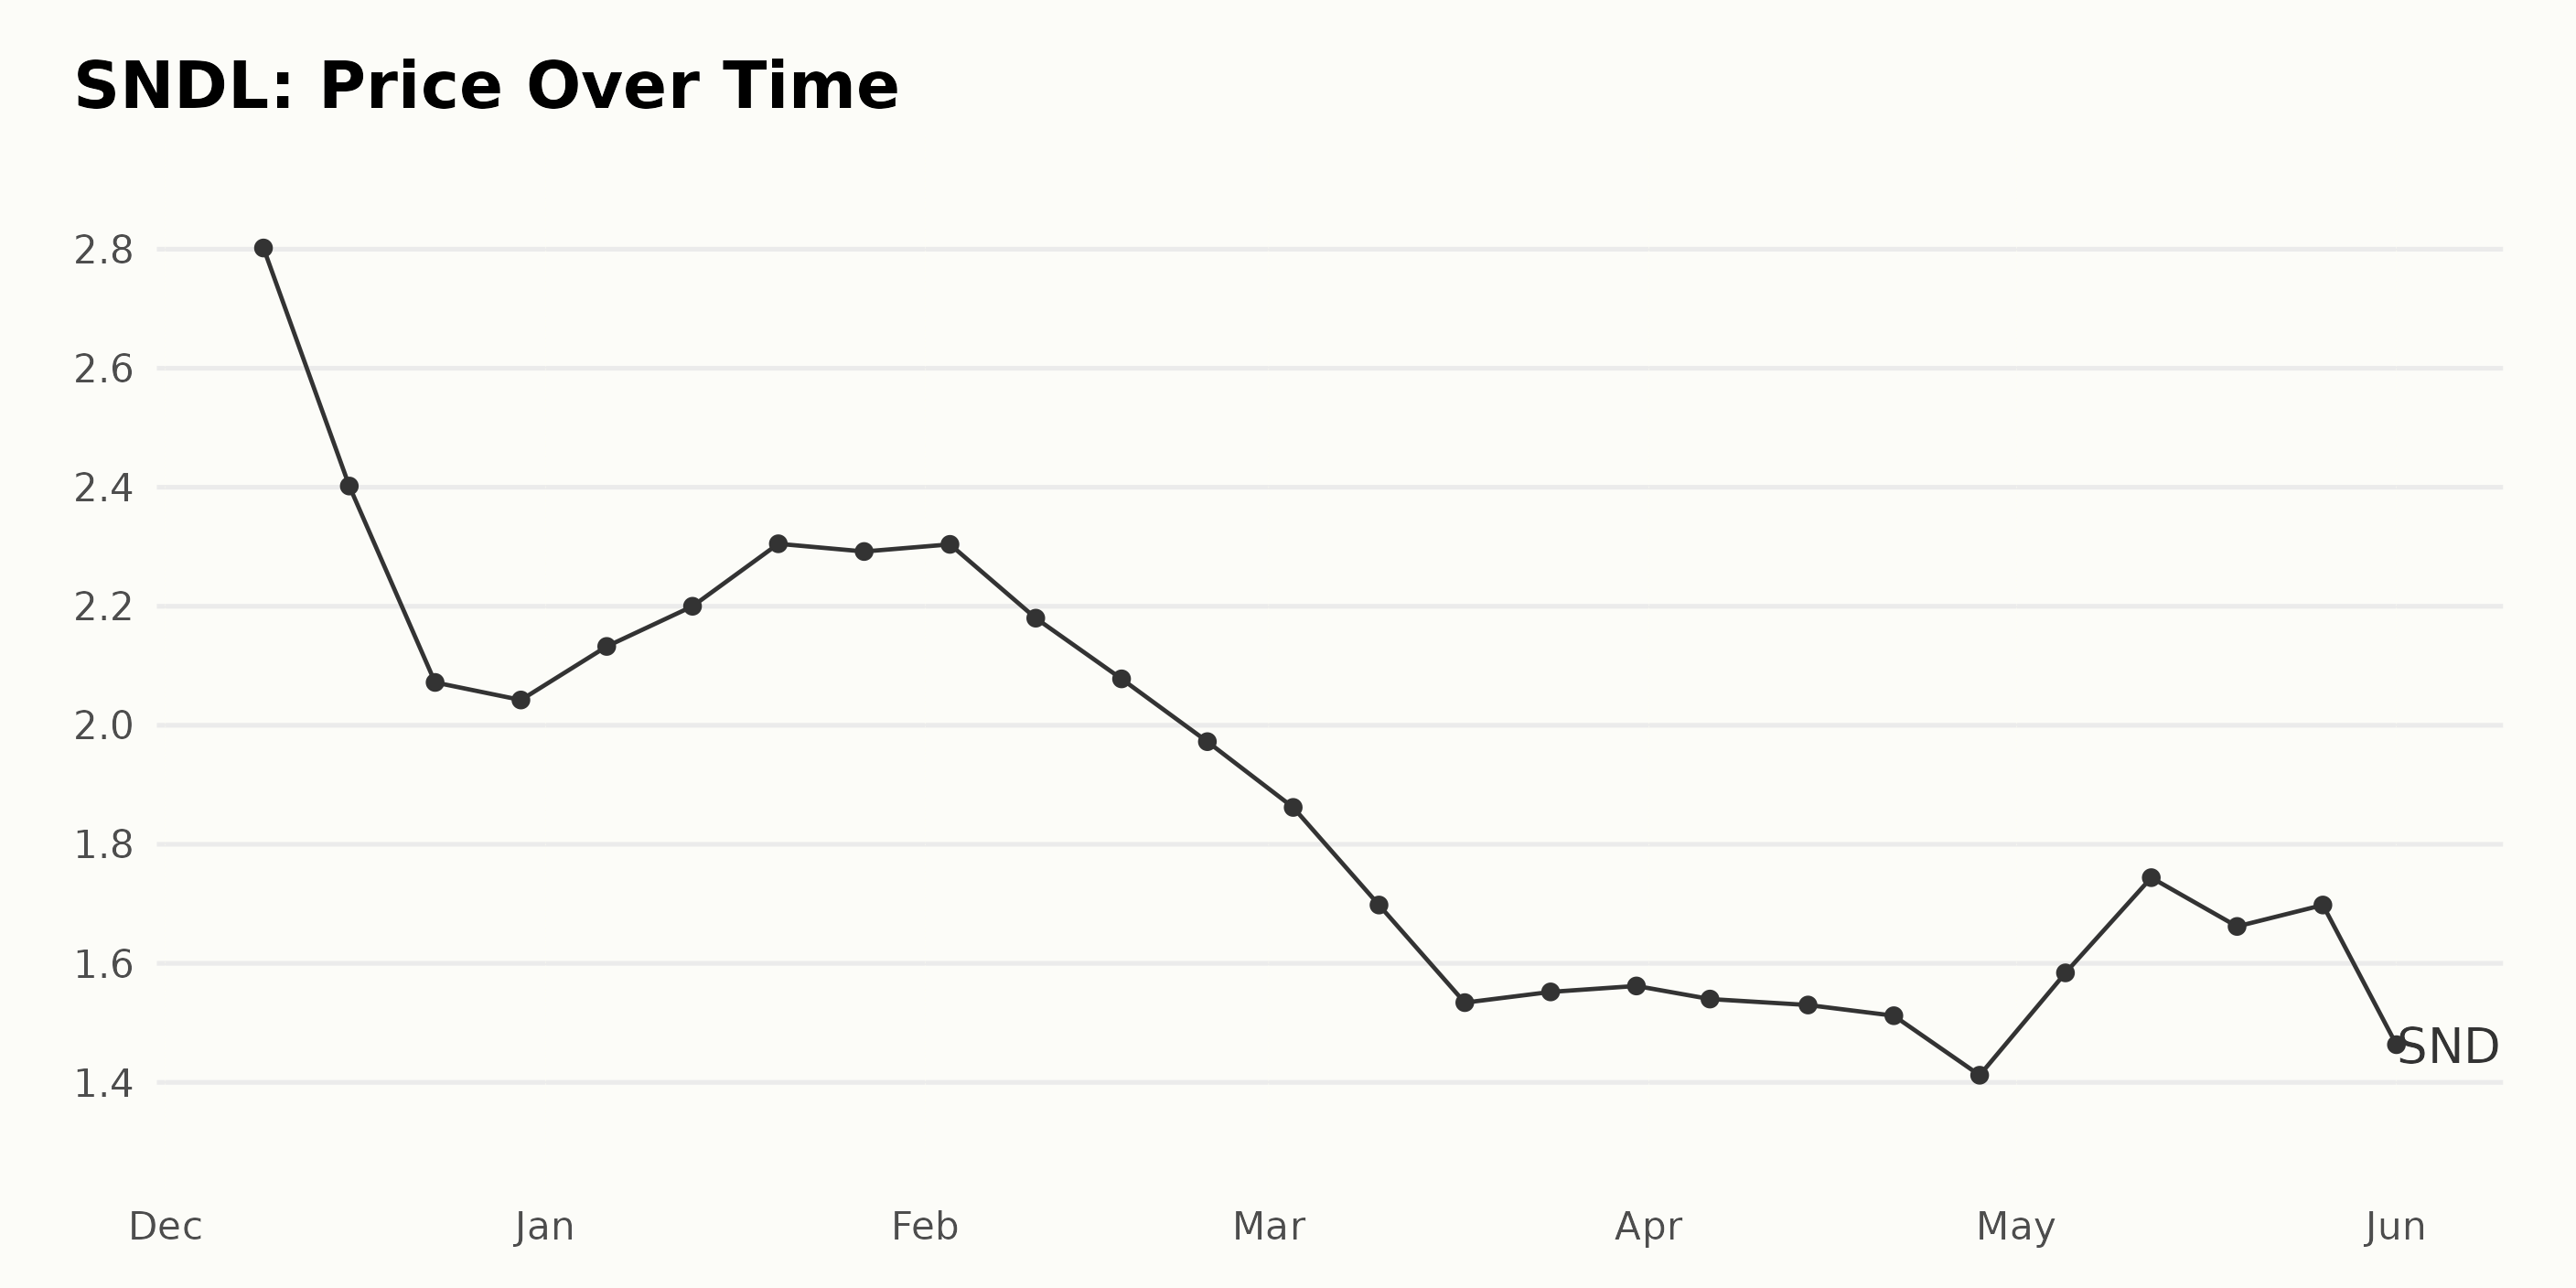
It looks like the share price of SNDL has been trending downward since December 9, 2022. The share price started with a high of $2.80 and a lower price of $1.42 on May 31, 2023. Here is a chart of SNDL's price over the past 180 days.
SNDL's POWR Rating Trends: Growth, Quality, and Value
The overall POWR Ratings grade of SNDL has been consistently D, equating to Sell, since December 2022, with its latest value as of May 31, 2023, being a low F, equating to a Strong Sell. It is ranked #165 in the 168 stocks in the D-rated Medical - Pharmaceuticals industry.
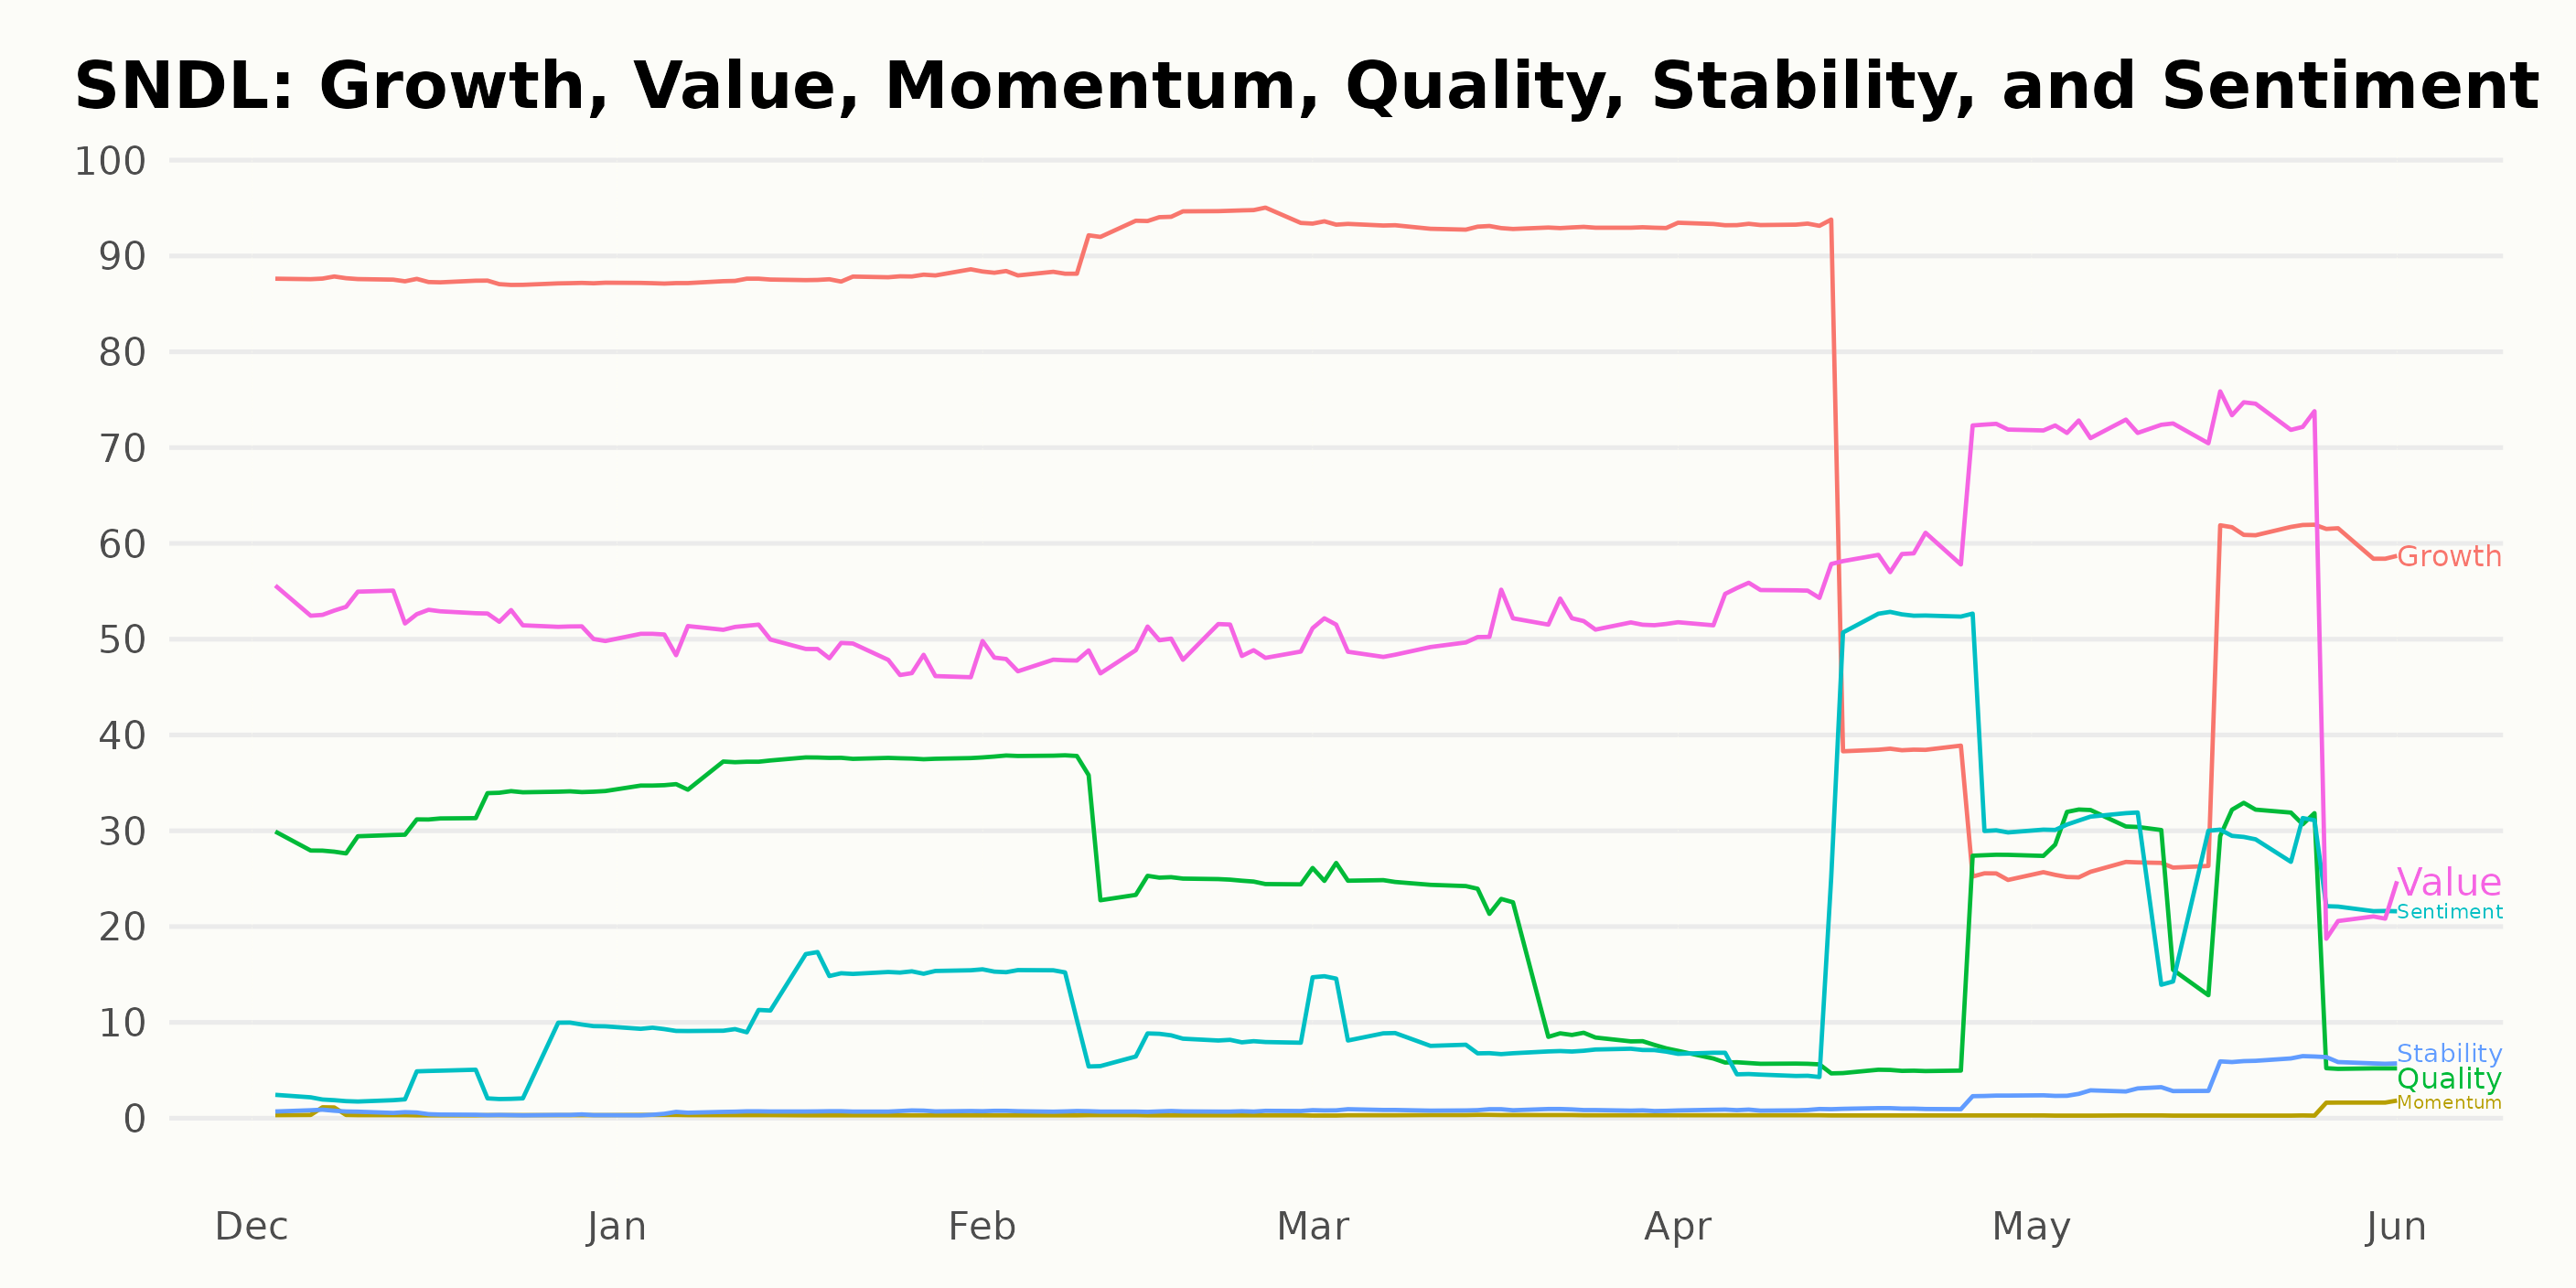
The POWR Ratings show noteworthy trends across three dimensions. Growth has been consistently high, starting from 87 on December 31, 2022, and increasing to 93 on March 31, 2023.
The Quality ratings have fluctuated, starting at 31 on December 31, 2022, and dropping to 10 on April 29, 2023, before recovering to 24 on May 31, 2023. Lastly, the Value rating has increased over time, from 53 on December 31, 2022, to 63 on May 31, 2023.
How does SNDL Inc. (SNDL) Stack Up Against its Peers?
Other stocks in the Medical - Pharmaceuticals sector that may be worth considering are Novartis AG (NVS), Novo Nordisk A/S (NVO), and AbbVie Inc. (ABBV) -- they have better POWR Ratings.
Discover 10 widely held stocks that our proprietary model shows have tremendous downside potential. Please make sure none of these “death trap” stocks are lurking in your portfolio:
SNDL shares were trading at $1.46 per share on Thursday afternoon, up $0.04 (+2.82%). Year-to-date, SNDL has declined -30.14%, versus a 10.74% rise in the benchmark S&P 500 index during the same period.
About the Author: Anushka Dutta

Anushka is an analyst whose interest in understanding the impact of broader economic changes on financial markets motivated her to pursue a career in investment research.
The post Is SNDL Inc. (SNDL) Overbought? appeared first on StockNews.com