
Ideanomics, Inc. (IDEX) develops zero-emission mobility solutions for the off and on-highway commercial vehicle markets. The company operates through the Ideanomics Mobility and the Ideanomics Capital business units.
On May 19, the company announced that it had received a notice from Nasdaq Stock Market LLC because of its inability to file its Form 10-Q for the period ended March 31, 2023. IDEX is not in compliance with Nasdaq Listing Rules for continued listing. Investors are staying away from the stock because of its delisting risk.
Prior to that, for the fiscal year 2022, the company reported a loss per share of $0.51, missing the consensus analyst estimate of $0.30 by 70%. Additionally, its revenue of $100.94 million missed the consensus estimate of $132.70 million by 23.9%.
Let’s look at some of IDEX’s key financial metrics trends to understand why it could be wise to avoid the stock now.
Analyzing IDEX’s Fluctuating Financial Performance from 2020 to 2022
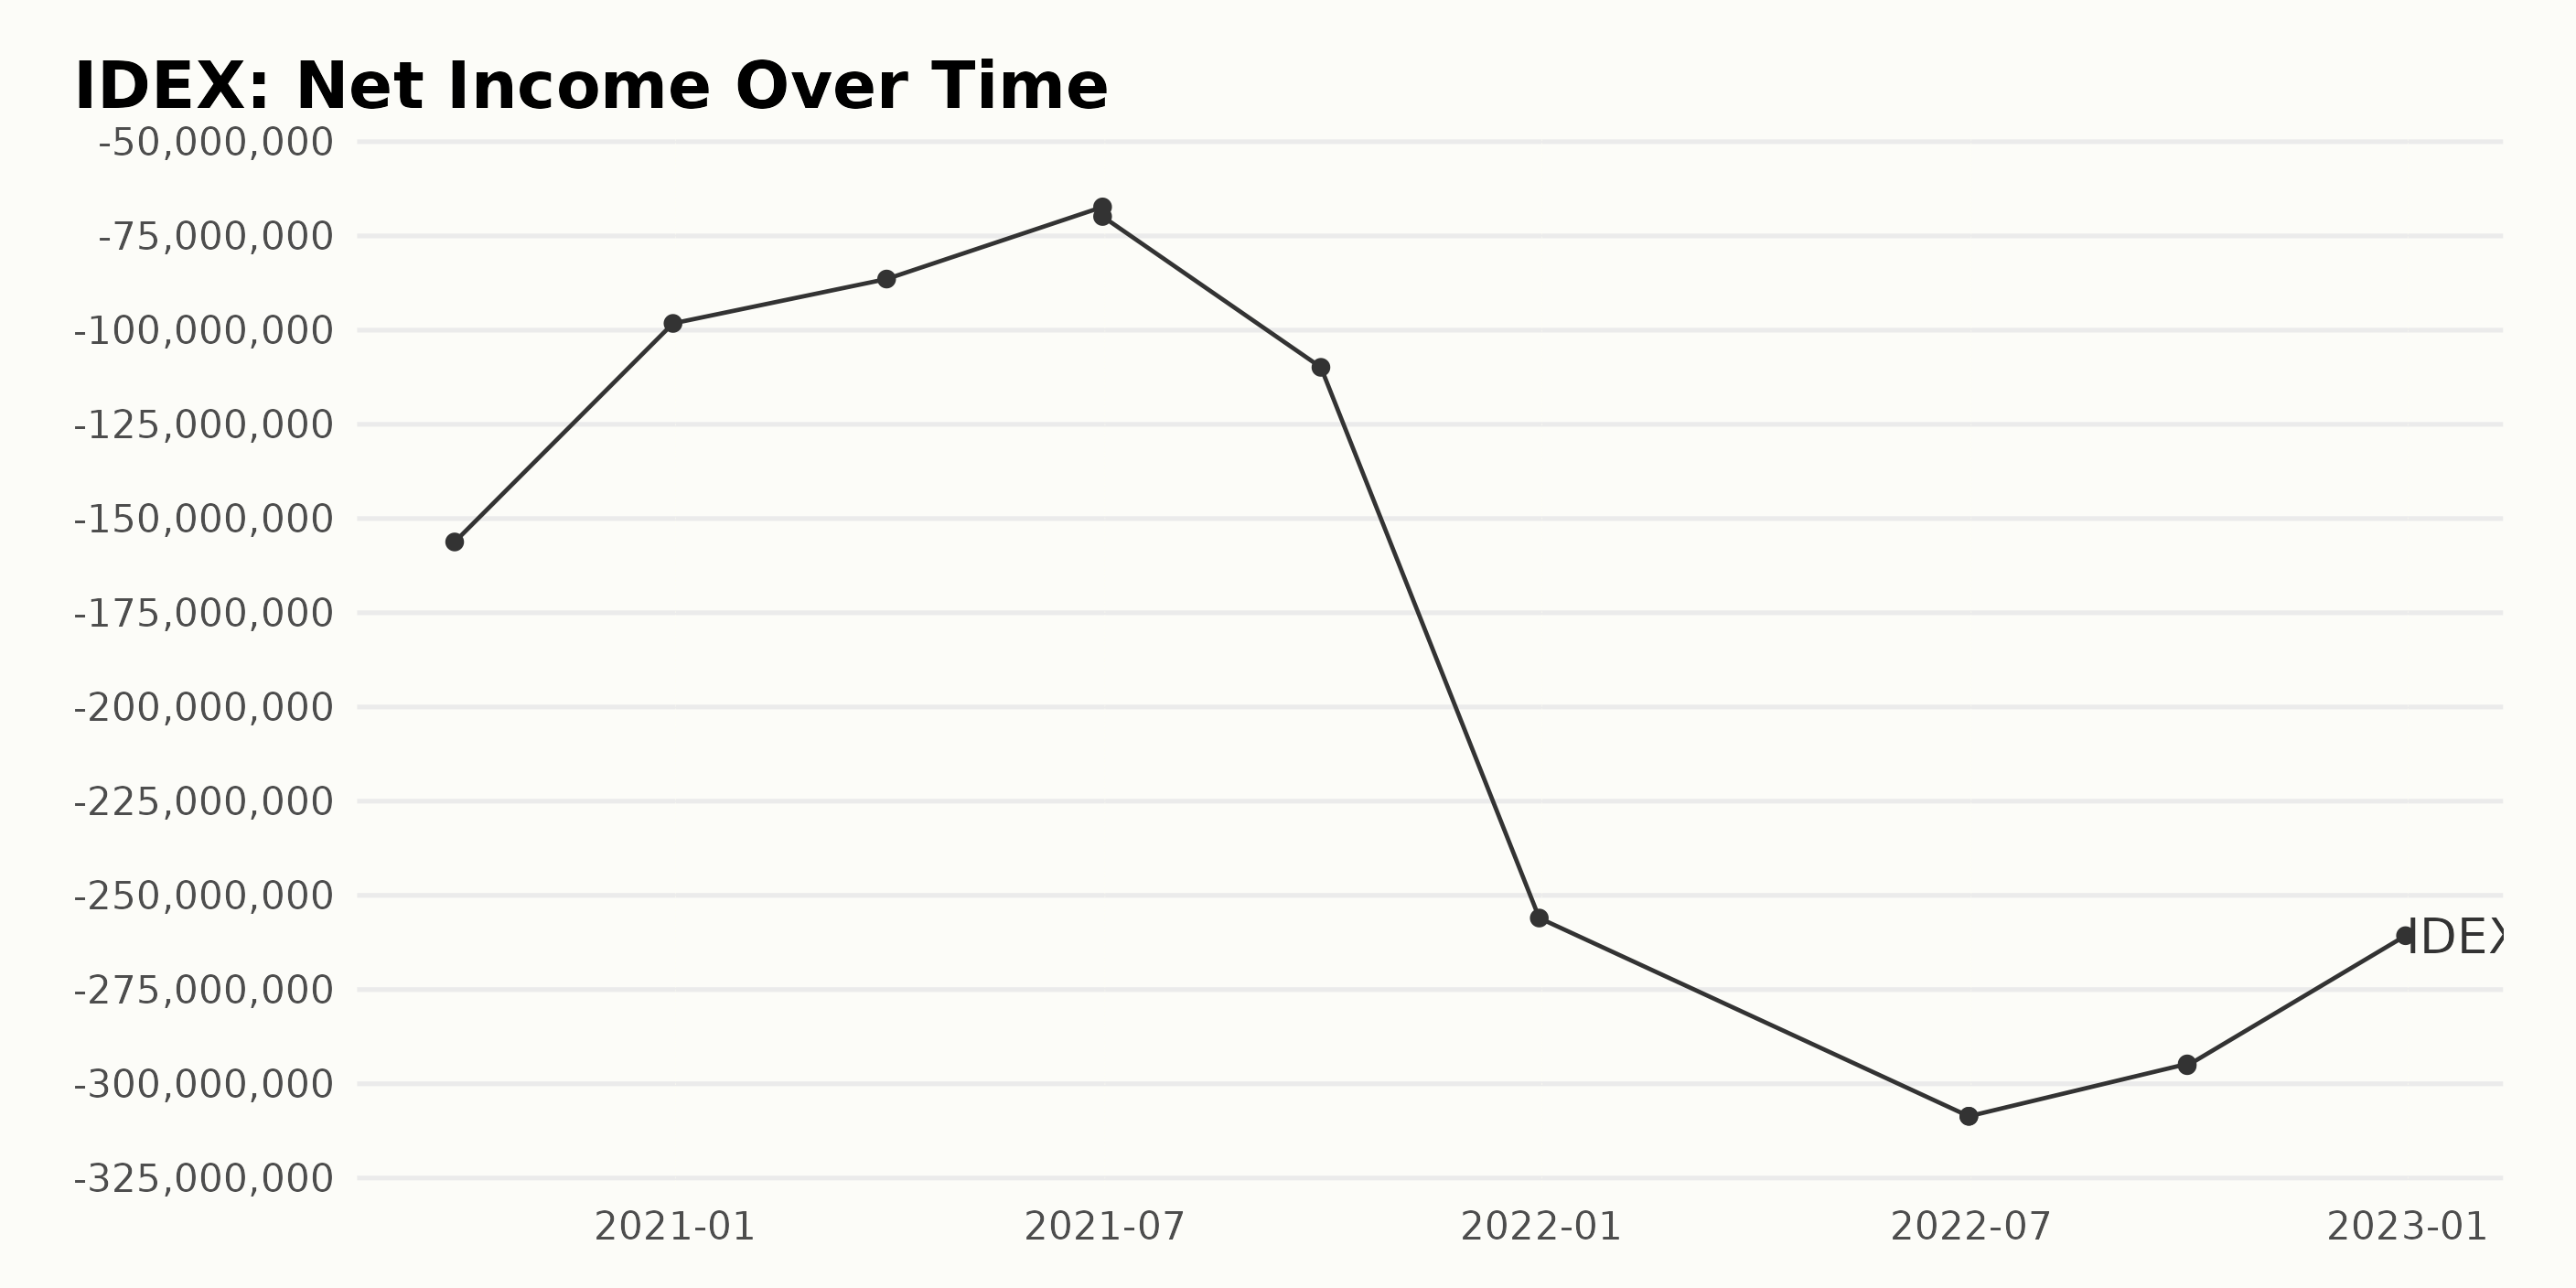
The time series data presented shows the fluctuations in the trailing-12-month net income of IDEX from September 2020 to December 2022. Here is a summary of the trend:
- In the third quarter of 2020, IDEX reported a net income of approximately -$156.22 million.
- The subsequent quarters saw a consistent improvement, with net income figures reaching -$98.22 million, -$86.44 million, and -$67.31 million, respectively, till the second quarter of 2021.
- However, a sudden decline was observed in the second half of 2021, with net income figures dropping to -$109.88 million and then a sharp dive to -$256.01 million by the end of the year.
- The first half of 2022 saw a further drop in net income to about -$308.62 million before somewhat improving to -$294.72 million, and slightly better at -$260.69 million at the end of the year.
These fluctuations in the figures indicate that IDEX has had a challenging period during the past two years regarding its profitability. A significant detail to note is that the initial upward trend took a downward spiral from the third quarter of 2021 onwards.
Calculating the growth rate from the first value to the last shows approximately a negative 67% change, suggesting an overall decline in the company's net income from September 2020 to December 2022.
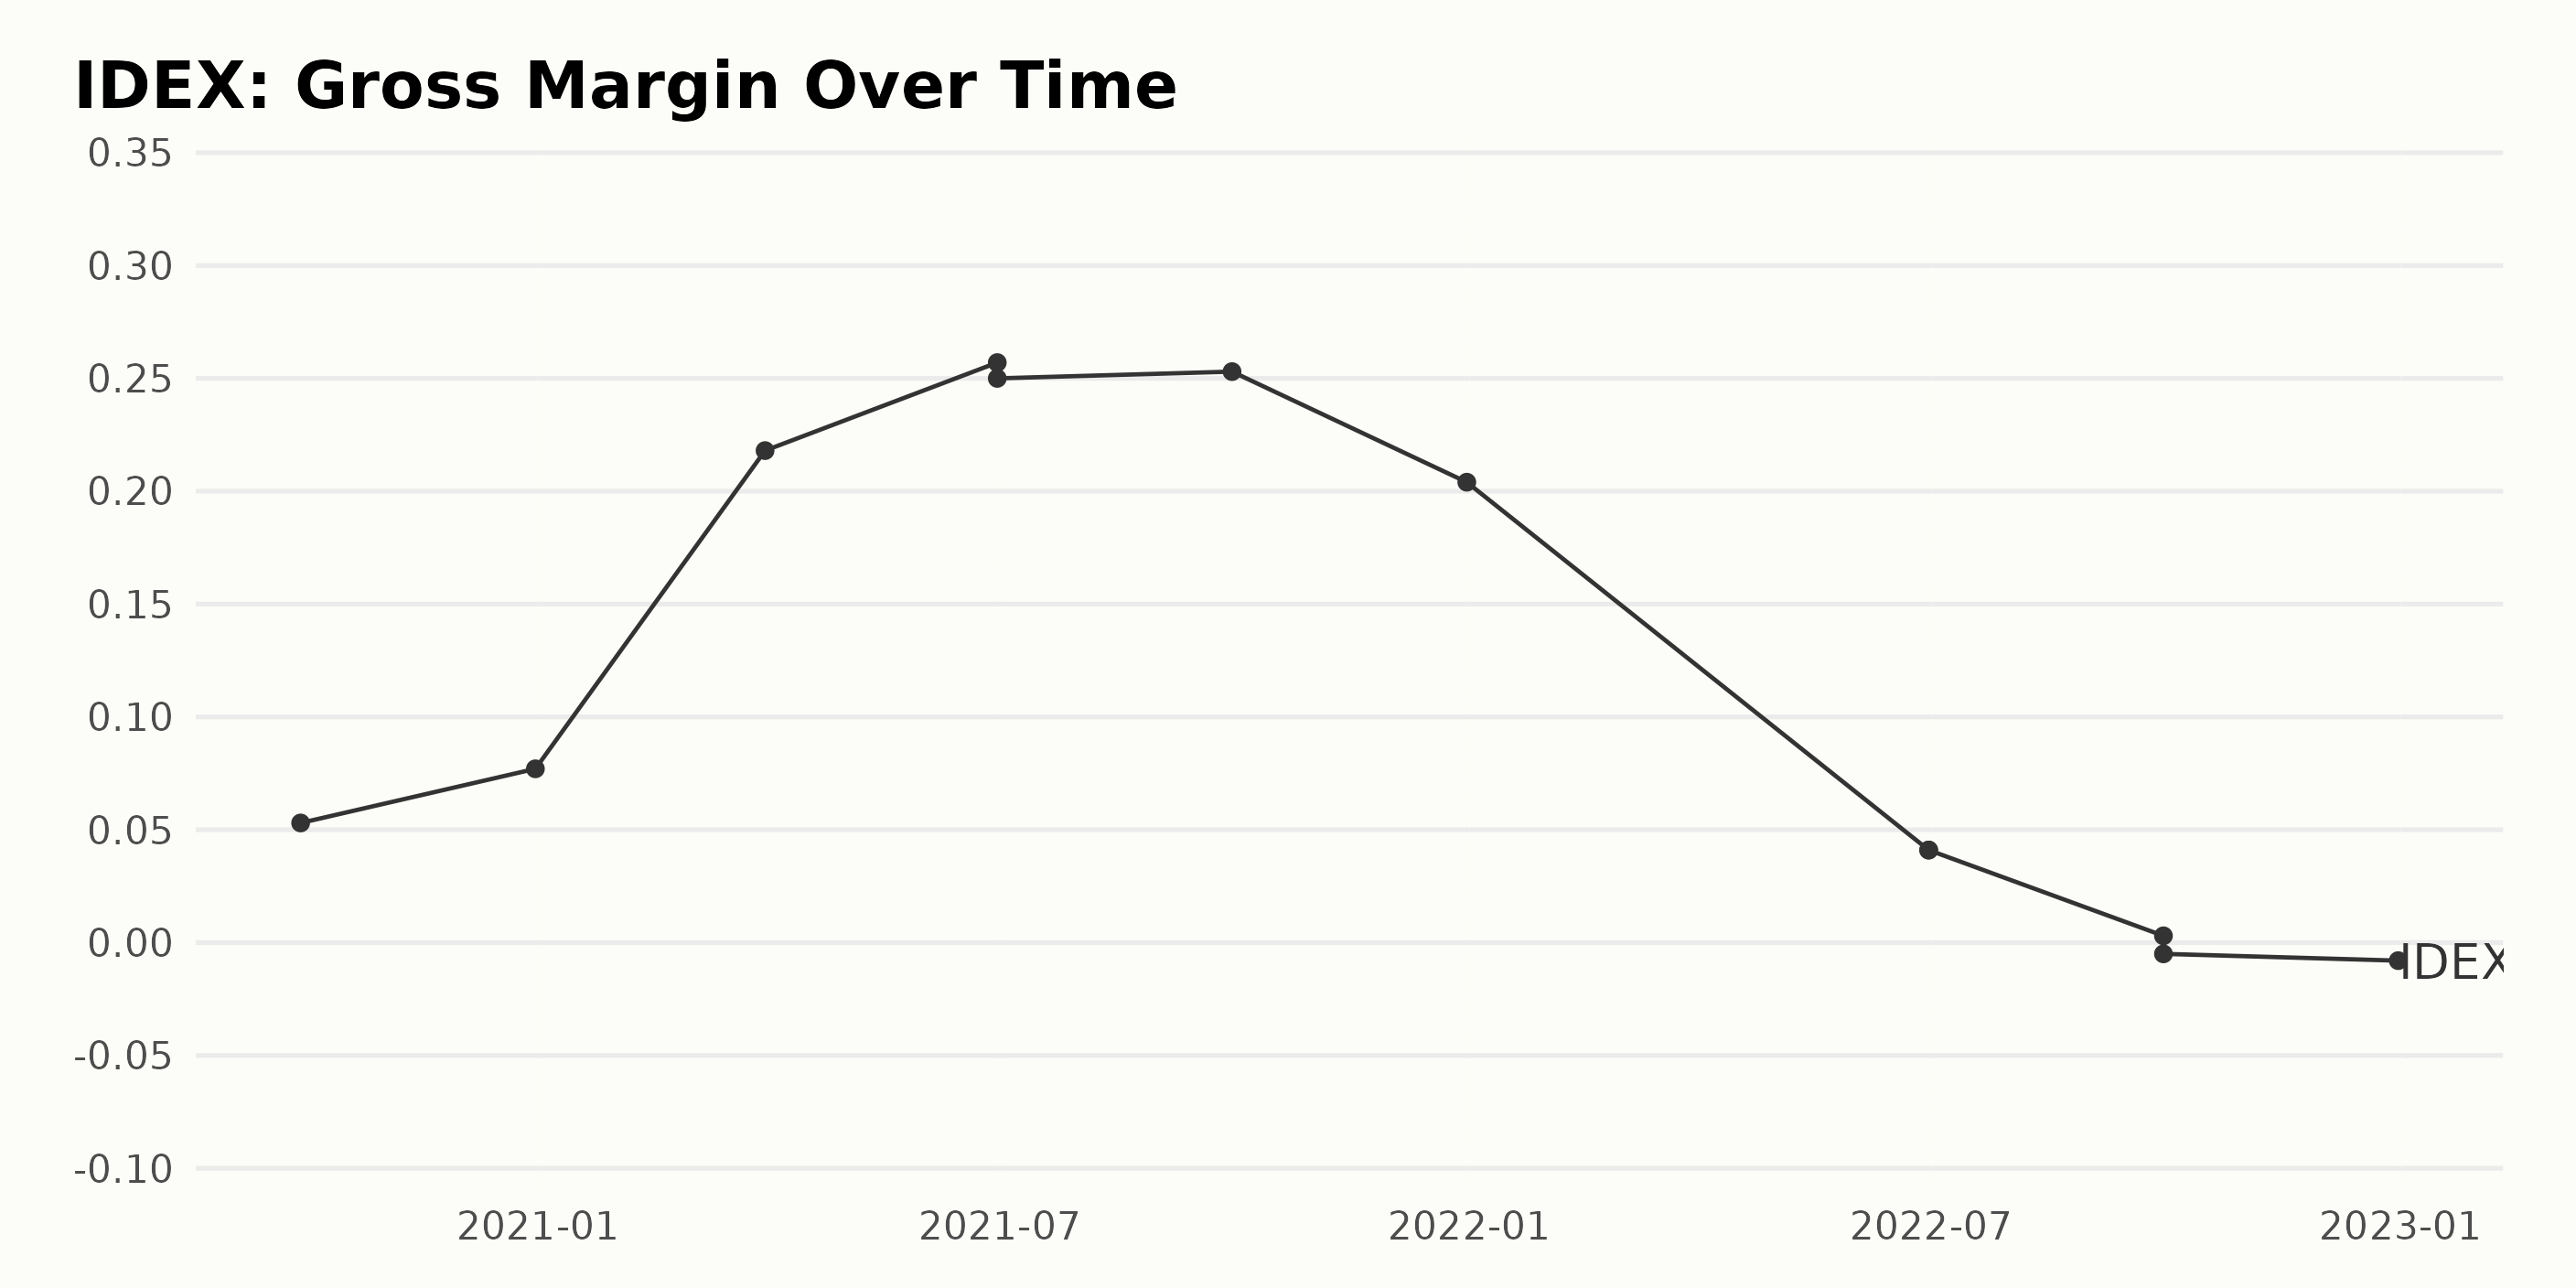
The gross margin of IDEX has shown a notable fluctuation from September 2020 to December 2022 based on the provided data series. Outlined below are key data points signifying these trends:
- As of September 30, 2020, the gross margin stood at 5.3%.
- The end of 2020 showed a positive trend, with the value increasing to 7.7% as of December 31, 2020.
- A significant increase followed in the first quarter of 2021, reporting a gross margin of 21.8% as of March 31, 2021.
- The peak margin was achieved in the second quarter of 2021 with a value of 25.7% as of June 30, 2021. However, this slightly dropped but remained high at 25% on the same date.
- The margin slightly decreased again to 25.3% as of September 30, 2021.
- A substantial drop was documented at the close of 2021, and the gross margin declined to 20.4%.
- The trend turned notably negative in 2022. As of June 30, 2022, the margin decreased to 4.1%, repeated on the same date.
- As of September 30, 2022, the company endured its lowest point, reported as 0.3%, which fell further to -0.5% on the same date.
- December 31, 2022, marked the end of the reported period with the gross margin at -0.8%.
The overall trend thus represents a sharp rise until mid-2021, followed by a continuous decline through the rest of the period. Comparing the first reported value to the last indicates a negative growth rate from 5.3% to -0.8%. The most pronounced trend is the rapid decrease from Q2 2021 to the end of 2022.
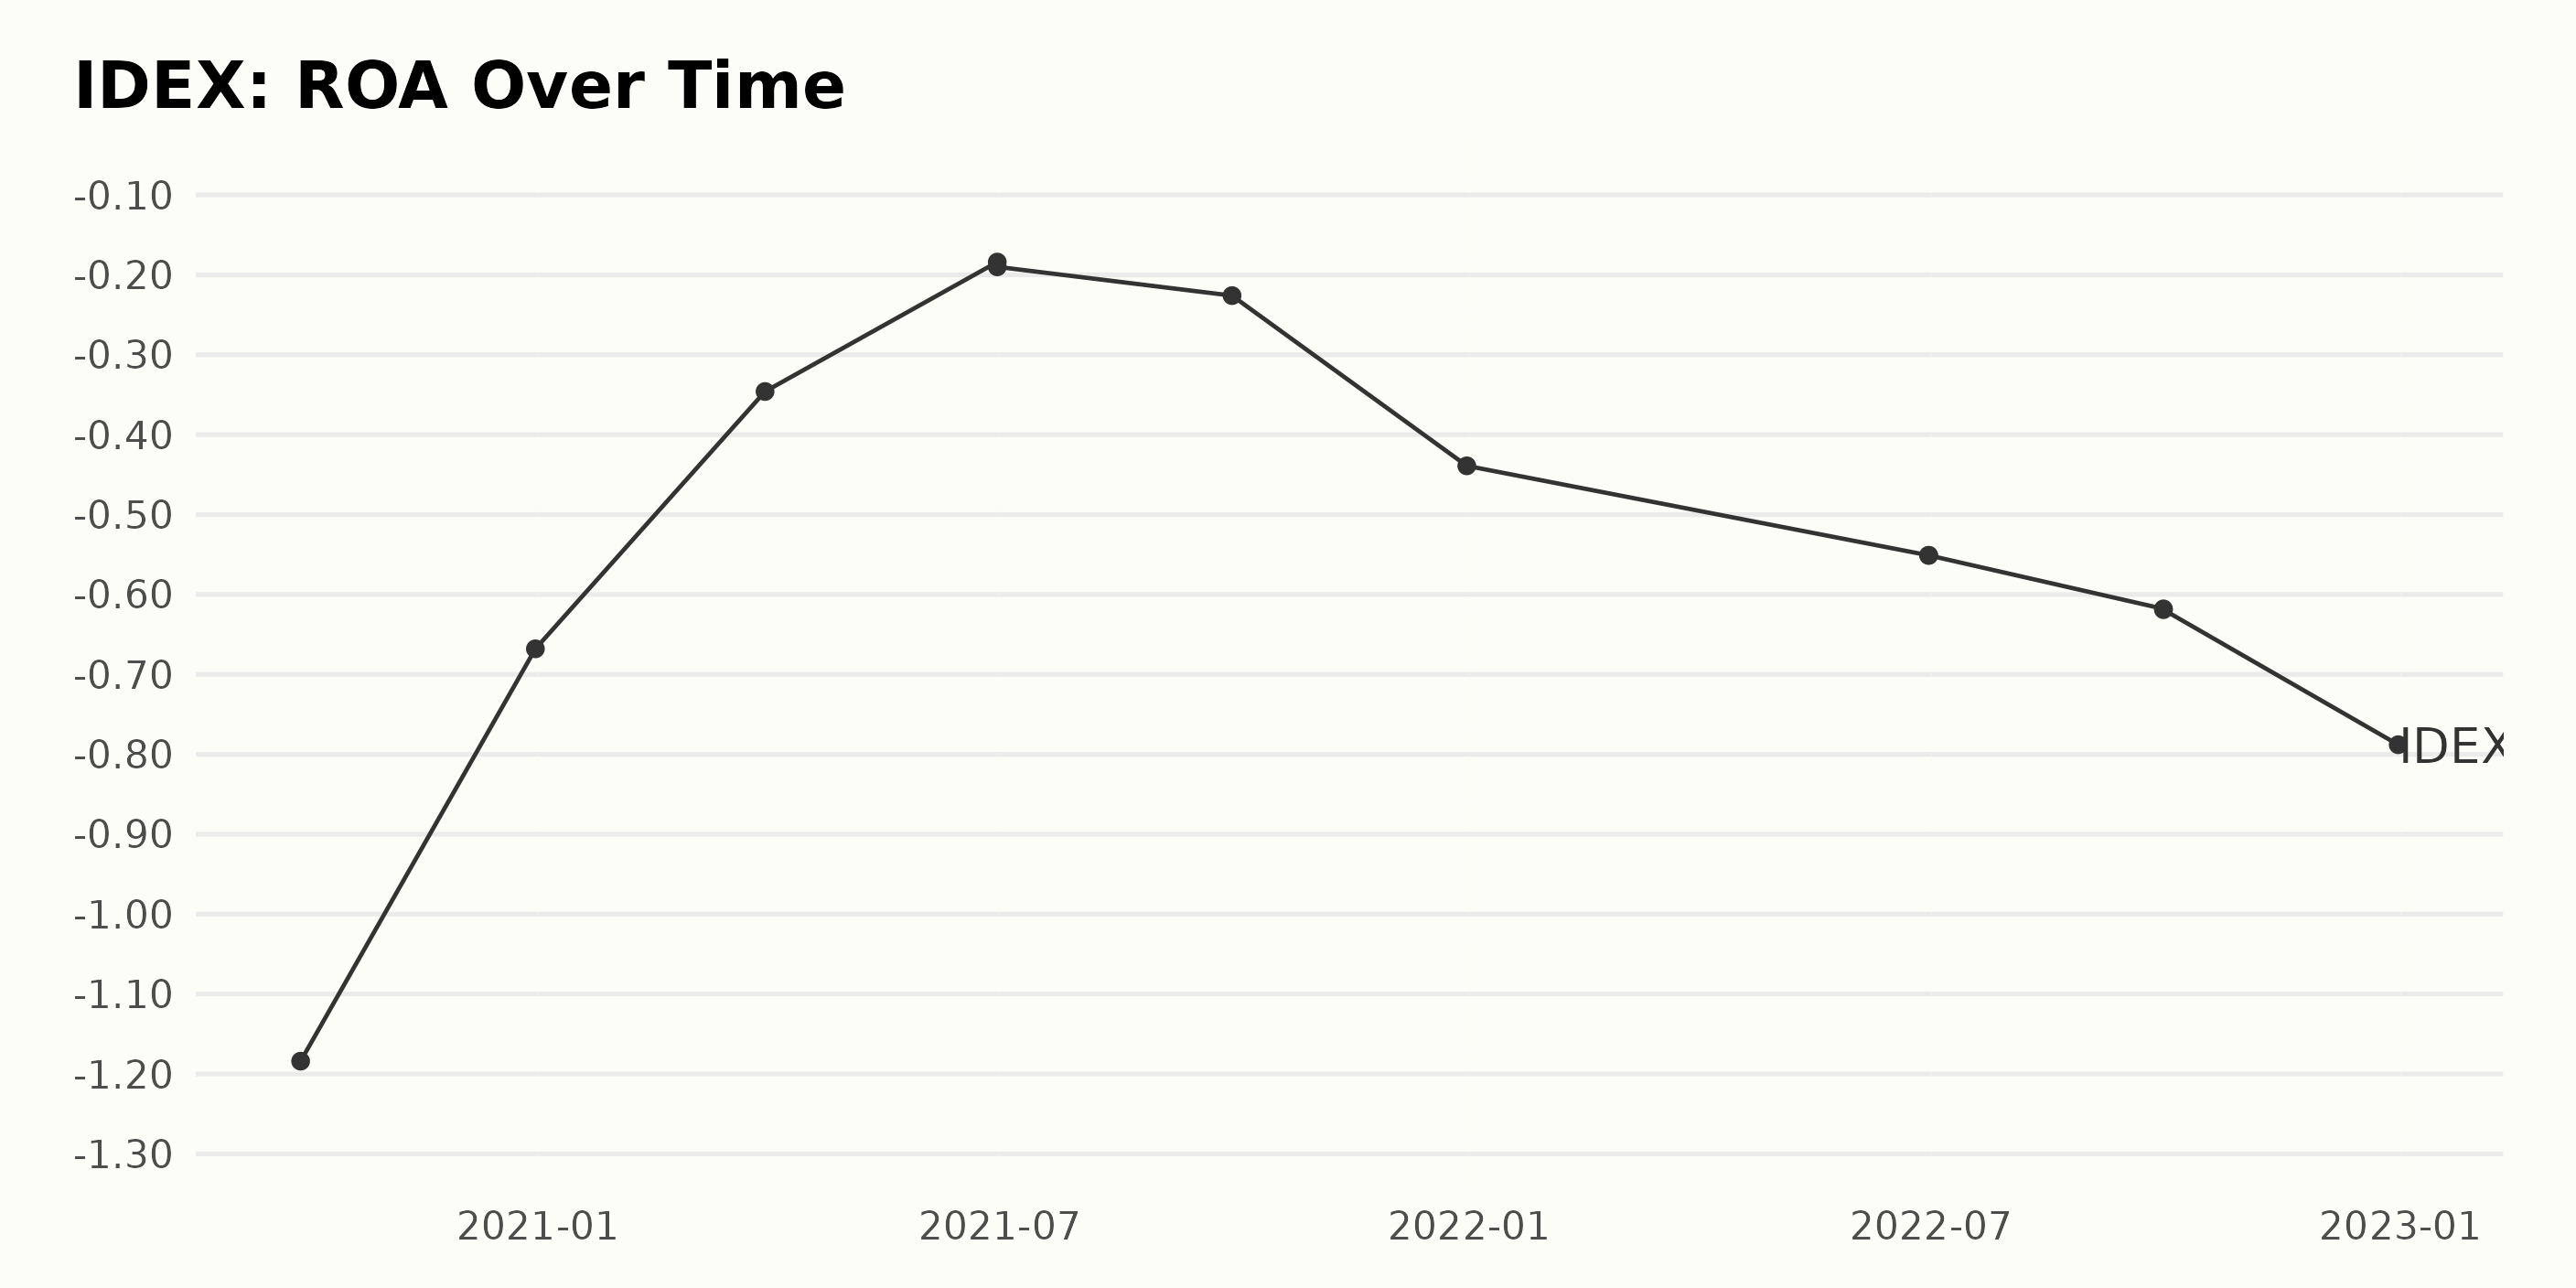
This is a summary of the trend and fluctuations in the Return On Assets (ROA) of IDEX from September 2020 to December 2022.
- The first recorded ROA for IDEX was -1.18 in September 2020.
- There was an improved trend in ROA until June 2021, with values gradually increasing in negativity, such as -0.67 in December 2020, -0.35 in March 2021, and stabilizing at about -0.19 by June 2021.
- After June 2021, the ROA for IDEX began to decline further. For instance, by September 2021, the ROA was recorded at -0.23, which had fallen sharply to -0.44 by December 2021.
- This trend of declining ROA continued into 2022. By June 2022, the ROA hit -0.55, then slightly dropped to -0.62 by September 2022.
- The last recorded value in December 2022 shows the ROA had dropped to -0.79.
Over the entire period from September 2020 to December 2022, IDEX's ROA has seen a significant decline of approximately 64%. The most notable period of this decline took place between June 2021 and December 2022.
This trend reflects that IDEX's profitability relative to its total assets worsened over this period, emphasizing the significant causes of this trend.
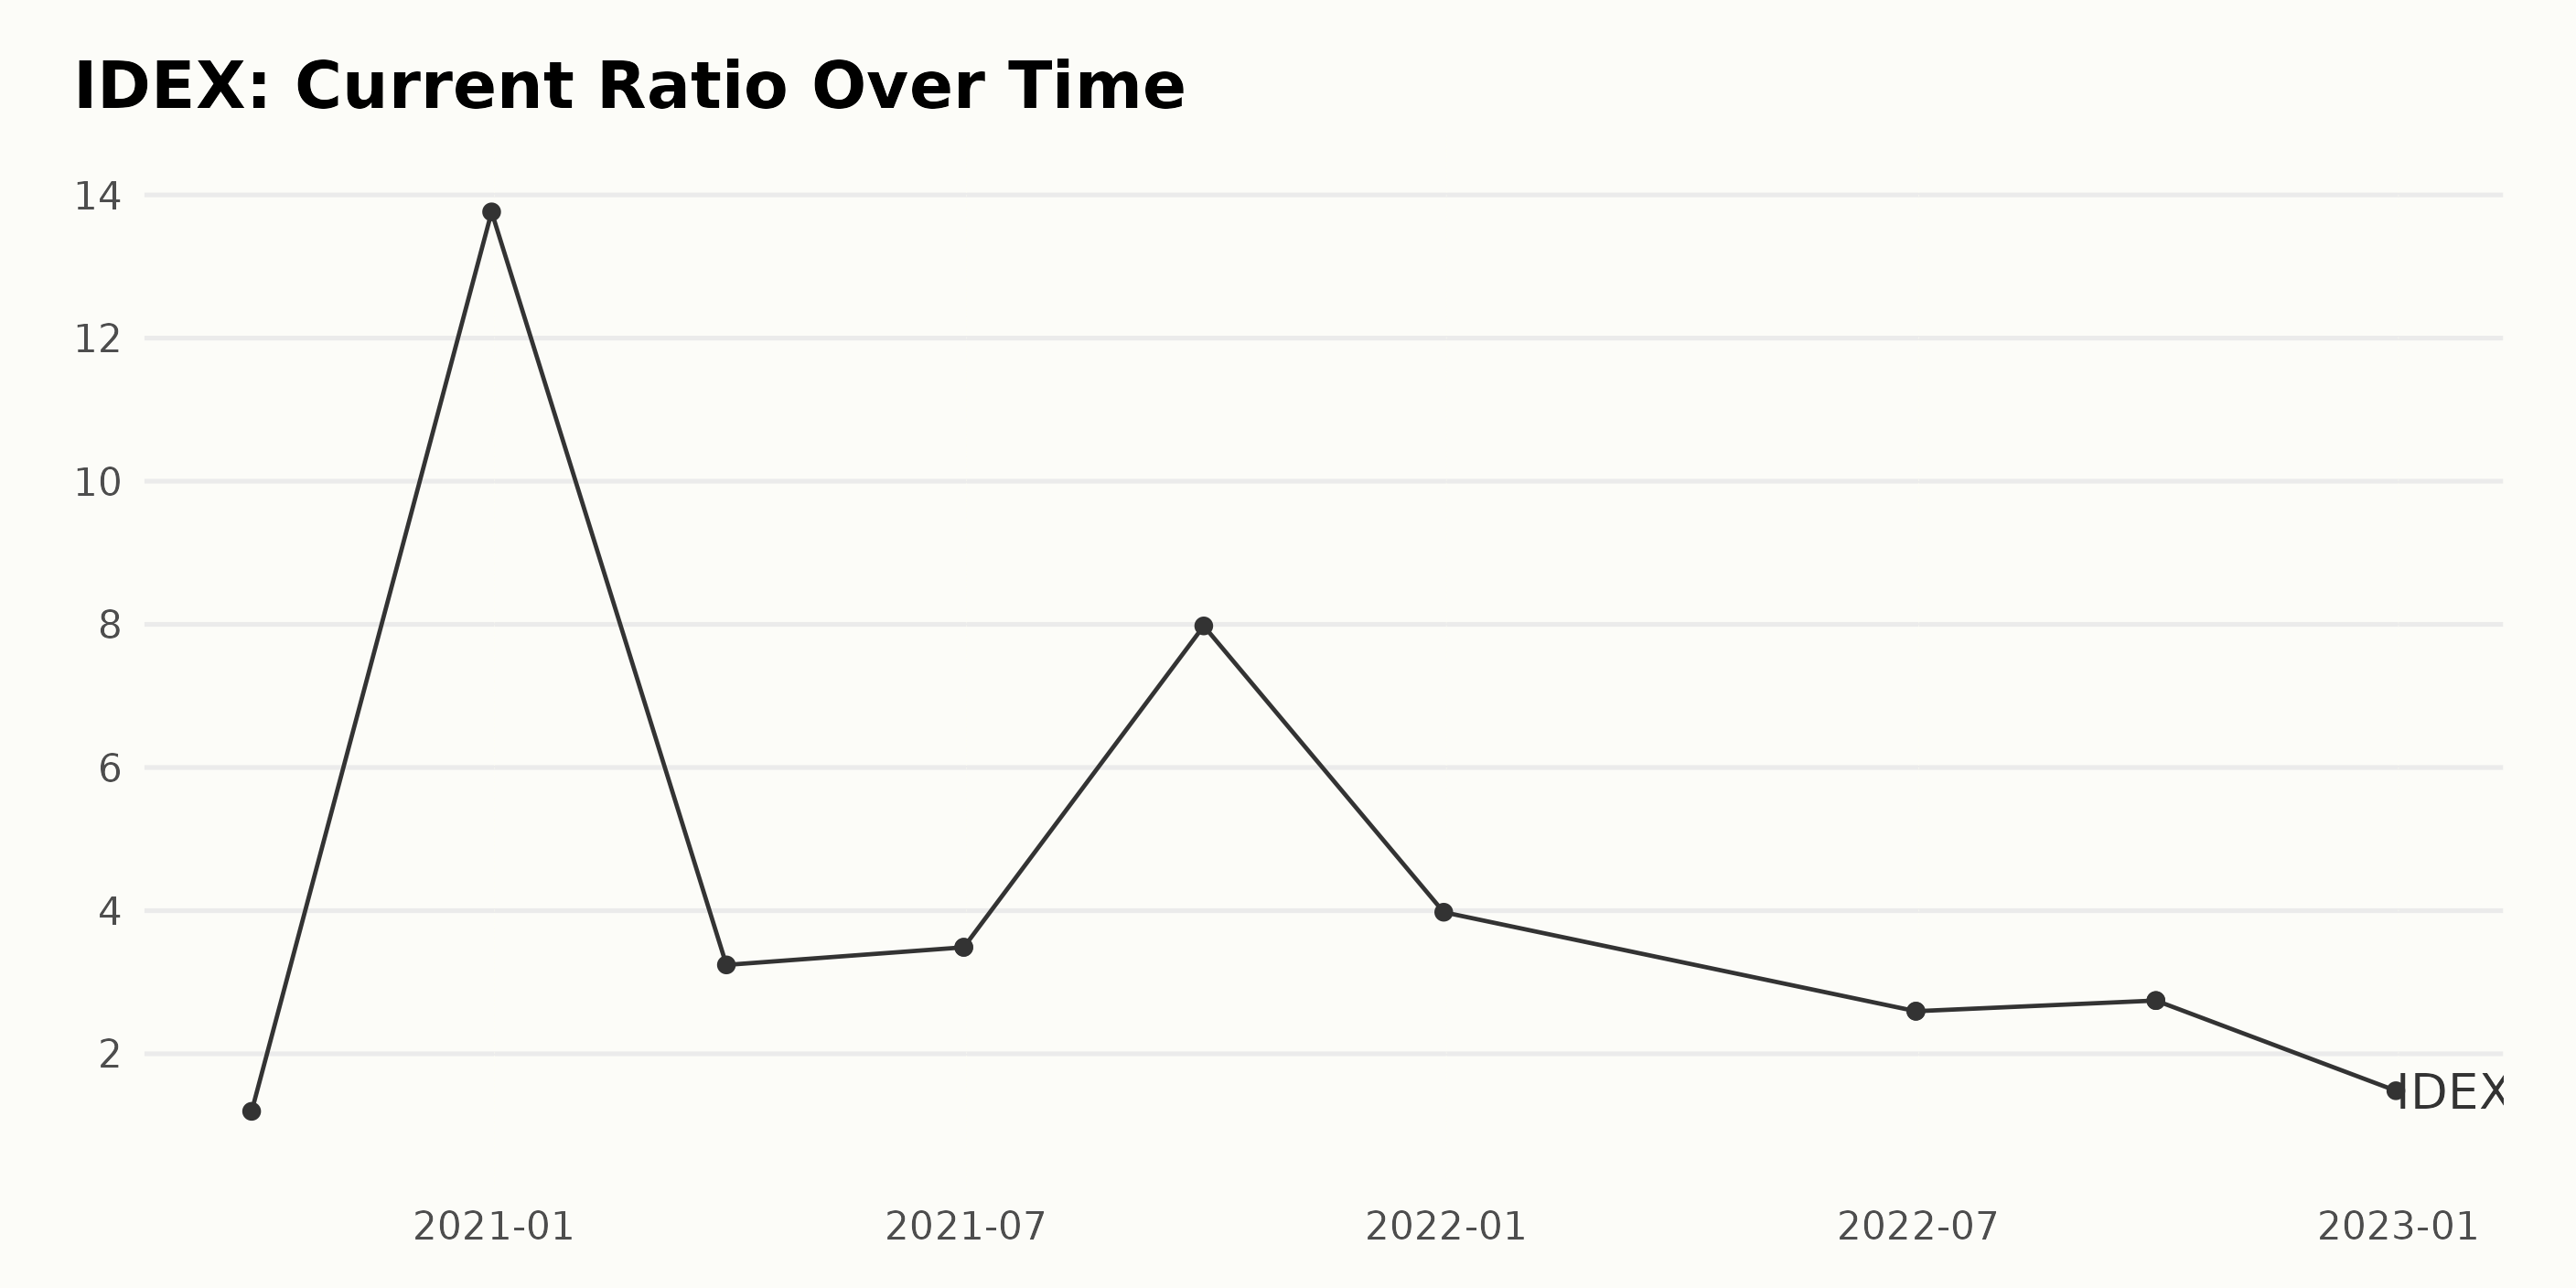
The current ratio of IDEX showcases a fluctuating trend within the given period, which spans from September 30, 2020, to December 31, 2022.
- September 2020: The current ratio began at 1.20.
- December 2020: There was an exponential rise to 13.76.
- March 2021: This was followed by a sharp drop to 3.24 by March 2021.
- June to September 2021: The ratio exhibited mild fluctuations during this period, peaking at around 3.49 in June, then increasing significantly to 7.98 in September.
- December 2021 to June 2022: A substantial falling trend was observed, with the ratio descending to 3.98 by the end of 2021 and further to 2.59 by June 2022. This downtrend continued until September when the ratio stabilized around 2.74.
- December 2022: As of the last recorded value on December 31, 2022, the current ratio has significantly fallen to 1.48.
These observations show a decline in the Current Ratio value from 1.20 in September 2020 to 1.48 in December 2022. This denotes an approximately 23.33% increase over time despite several fluctuations throughout the periods.
IDEX Share Price Analysis: Depreciation and Inconsistent Growth in 2023
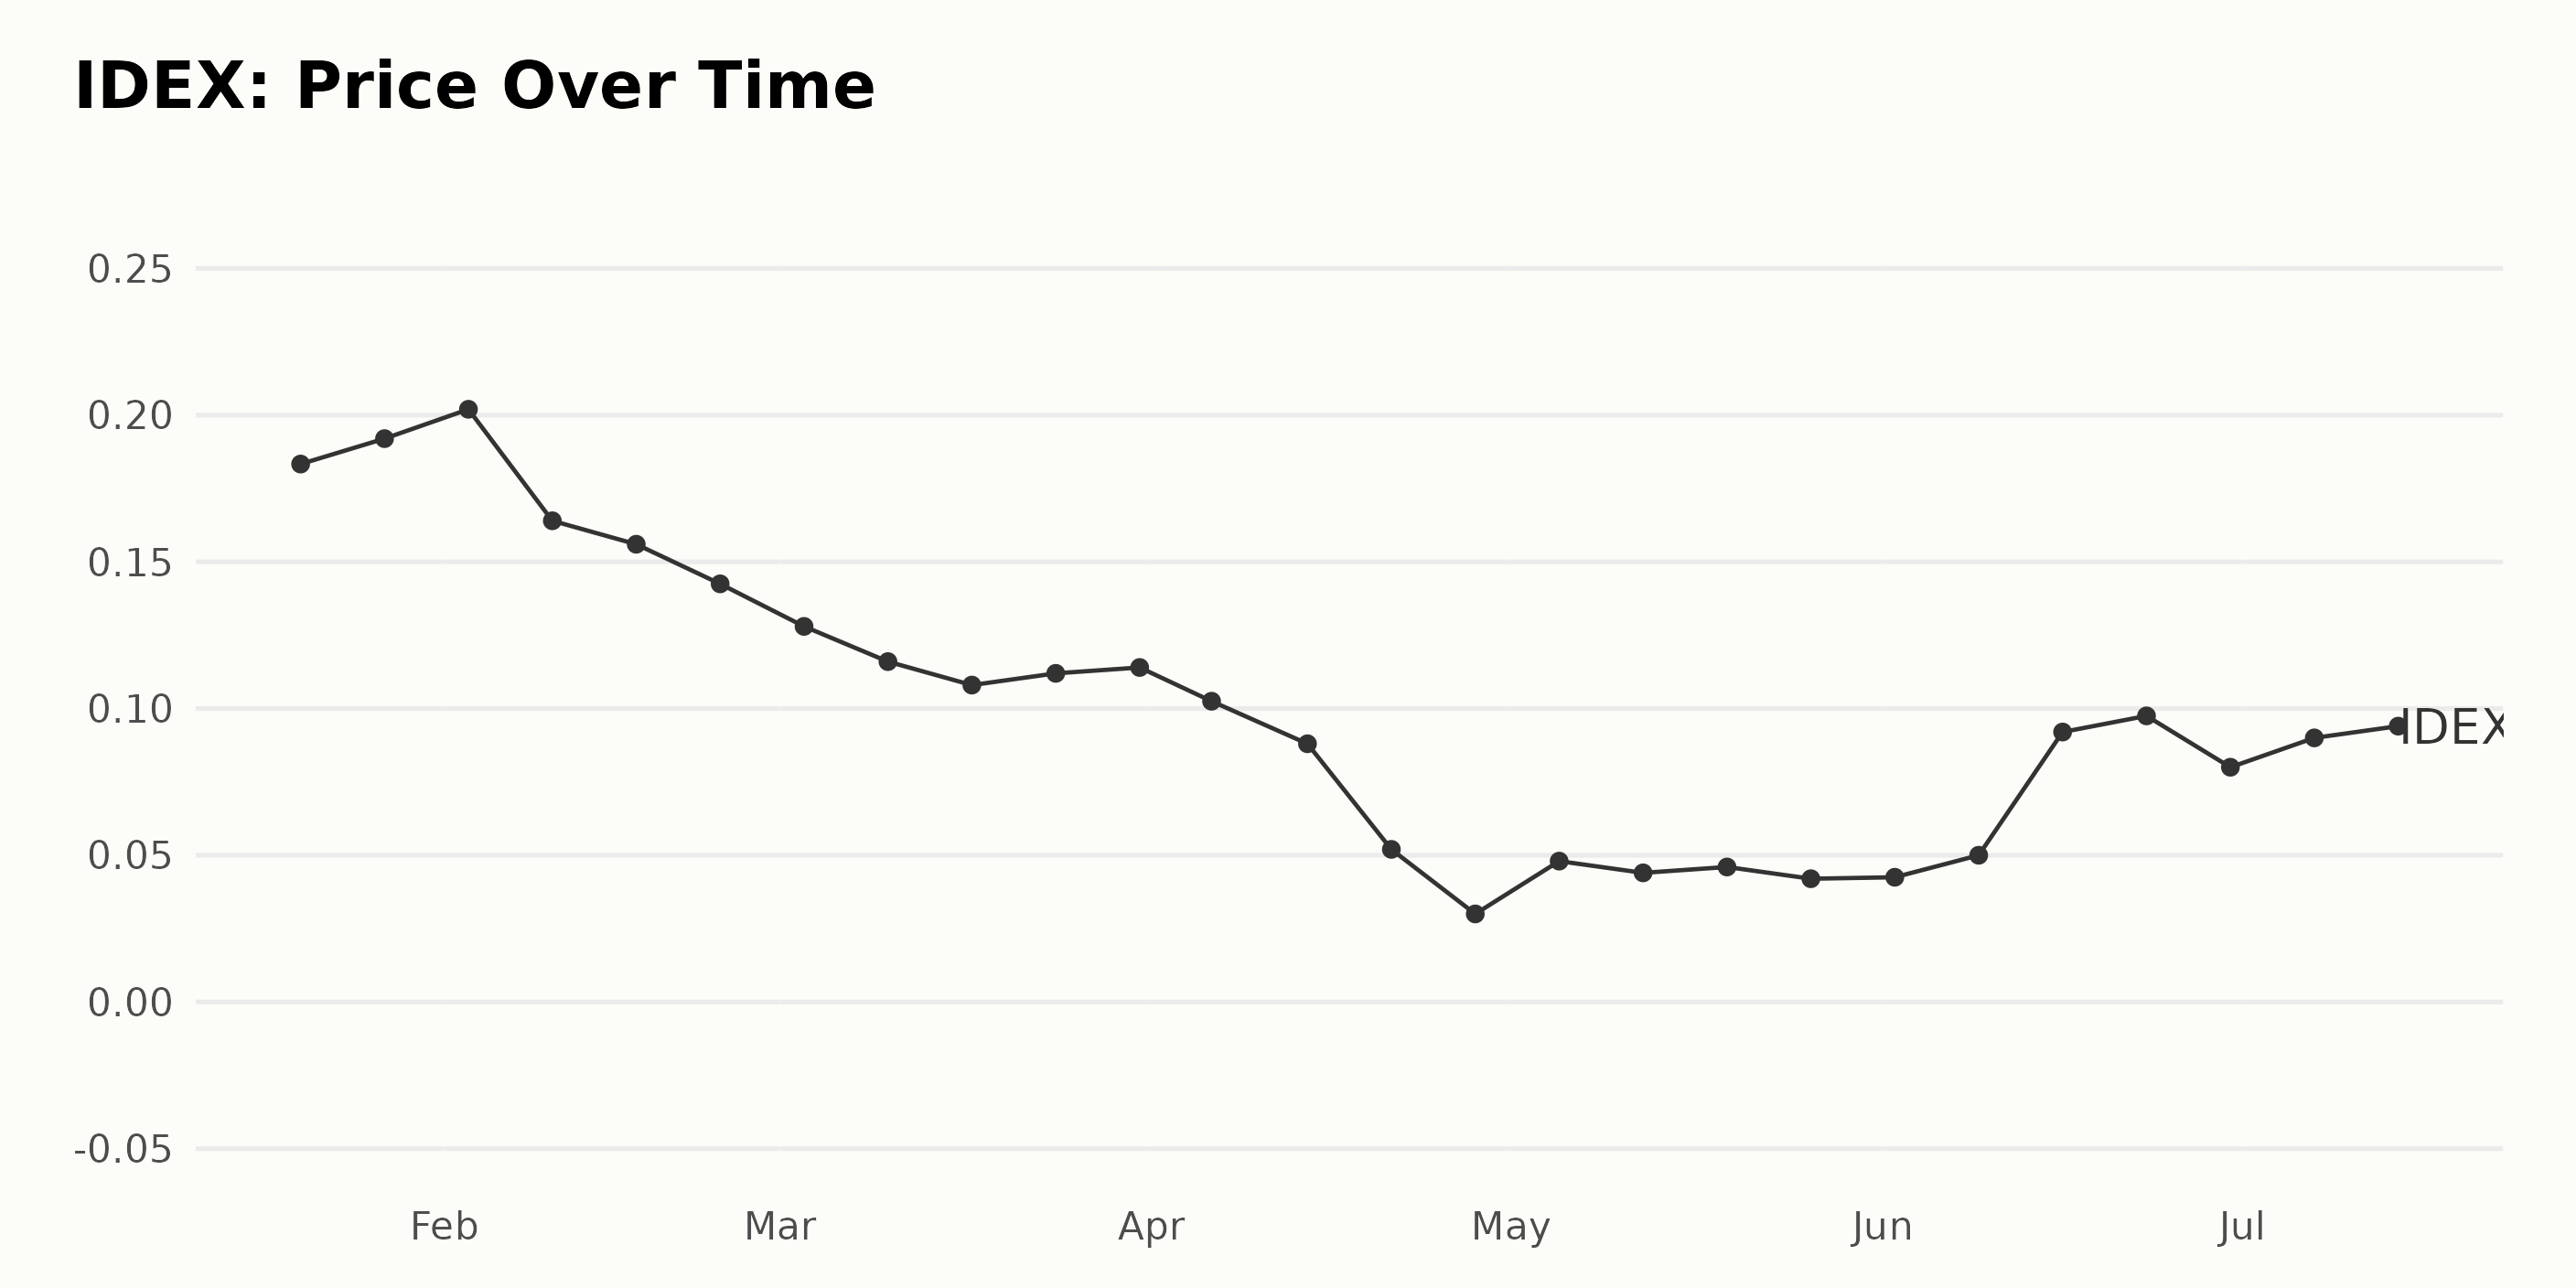
The share prices for IDEX show a general trend of decline from January 2023 to May 2023, followed by inconsistent growth with minor fluctuations from May 2023 to July 2023. Here is a breakdown of the trends:
- On January 20, 2023, the share price of IDEX was $0.18.
- The price saw a minor increase until February 3, 2023, peaking at $0.20.
- From February 10, 2023, to March 24, 2023, the share price noticeably declined from $0.16 to $0.11.
- The lowest share price within this period was on April 28, 2023, dropping down to $0.03.
- However, a slow increase began around May 5, 2023, starting at $0.05.
- By June 23, 2023, the price had peaked at $0.10.
- This was quickly followed by a slight drop to $0.08 on June 30, 2023.
- The rate then marginally went up again to $0.09 on July 7, 2023, and remained almost steady at $0.09 on July 14, 2023.
The share price of IDEX underwent a general deceleration from January to April 2023 before experiencing an inconsistent acceleration from May to July 2023. Please note that the data presents several fluctuations throughout the observed period, and a clear, steady trend isn't exhibited in the later months. Here is a chart of IDEX's price over the past 180 days.
POWR Ratings Reflect Solid Prospects
IDEX’s bleak prospects are reflected in its POWR Ratings. The stock has an overall rating of F, equating to a Strong Sell in our proprietary rating system. The POWR Ratings are calculated considering 118 different factors, with each factor weighted to an optimal degree.
Our proprietary rating system also evaluates each stock based on eight distinct categories. IDEX also has an F grade for Value and Quality and a D for Stability. It is ranked #146 out of the 152 stocks in the D-rated Software – Application industry.
Click here to see the additional ratings for IDEX (Growth, Momentum, and Sentiment).
How does Ideanomics, Inc. (IDEX) Stack Up Against its Peers?
Other stocks in the Software - Application sector that may be worth considering are eGain Corporation (EGAN), IBEX Limited (IBEX), and Karooooo Ltd. (KARO) - they have better POWR Ratings.
43 Year Investment Pro Shares Top Picks
Steve Reitmeister is best known for his timely market outlooks & unique trading plans to stay on the right side of the market action. Click below to get his latest insights…
Steve Reitmeister’s Trading Plan & Top Picks >
IDEX shares were trading at $0.10 per share on Monday morning, down $0.00 (+4.78%). Year-to-date, IDEX has declined -39.02%, versus a 18.65% rise in the benchmark S&P 500 index during the same period.
About the Author: Anushka Dutta

Anushka is an analyst whose interest in understanding the impact of broader economic changes on financial markets motivated her to pursue a career in investment research.
The post Is There Any Buying Interest in Ideanomics (IDEX)? appeared first on StockNews.com