
Unity Software Inc. (U) provides a platform that offers software solutions to create, run, and monetize interactive, real-time 2D and 3D content for mobile phones, tablets, consoles, and Augmented Reality (AR) and Virtual Reality (VR) devices.
In late June, U announced an Artificial Intelligence (AI) software marketplace, which boosted its stock price. The company’s customers could access choices such as generating game dialogue or textures and graphics using AI from independent companies.
However, U’s stretched valuation is concerning. In terms of its forward non-GAAP P/E, the stock is trading at 106.69x, 336% higher than the industry average of 24.47x. Also, its forward EV/EBITDA multiple of 71.11 is 375.5% higher than the 14.95 industry multiple.
Given this backdrop, let’s look at the trends of U’s key financial metrics to understand why it might be wise to avoid the stock now.
A Detailed Analysis of Unity Software’s Financial Performance and Market Prediction
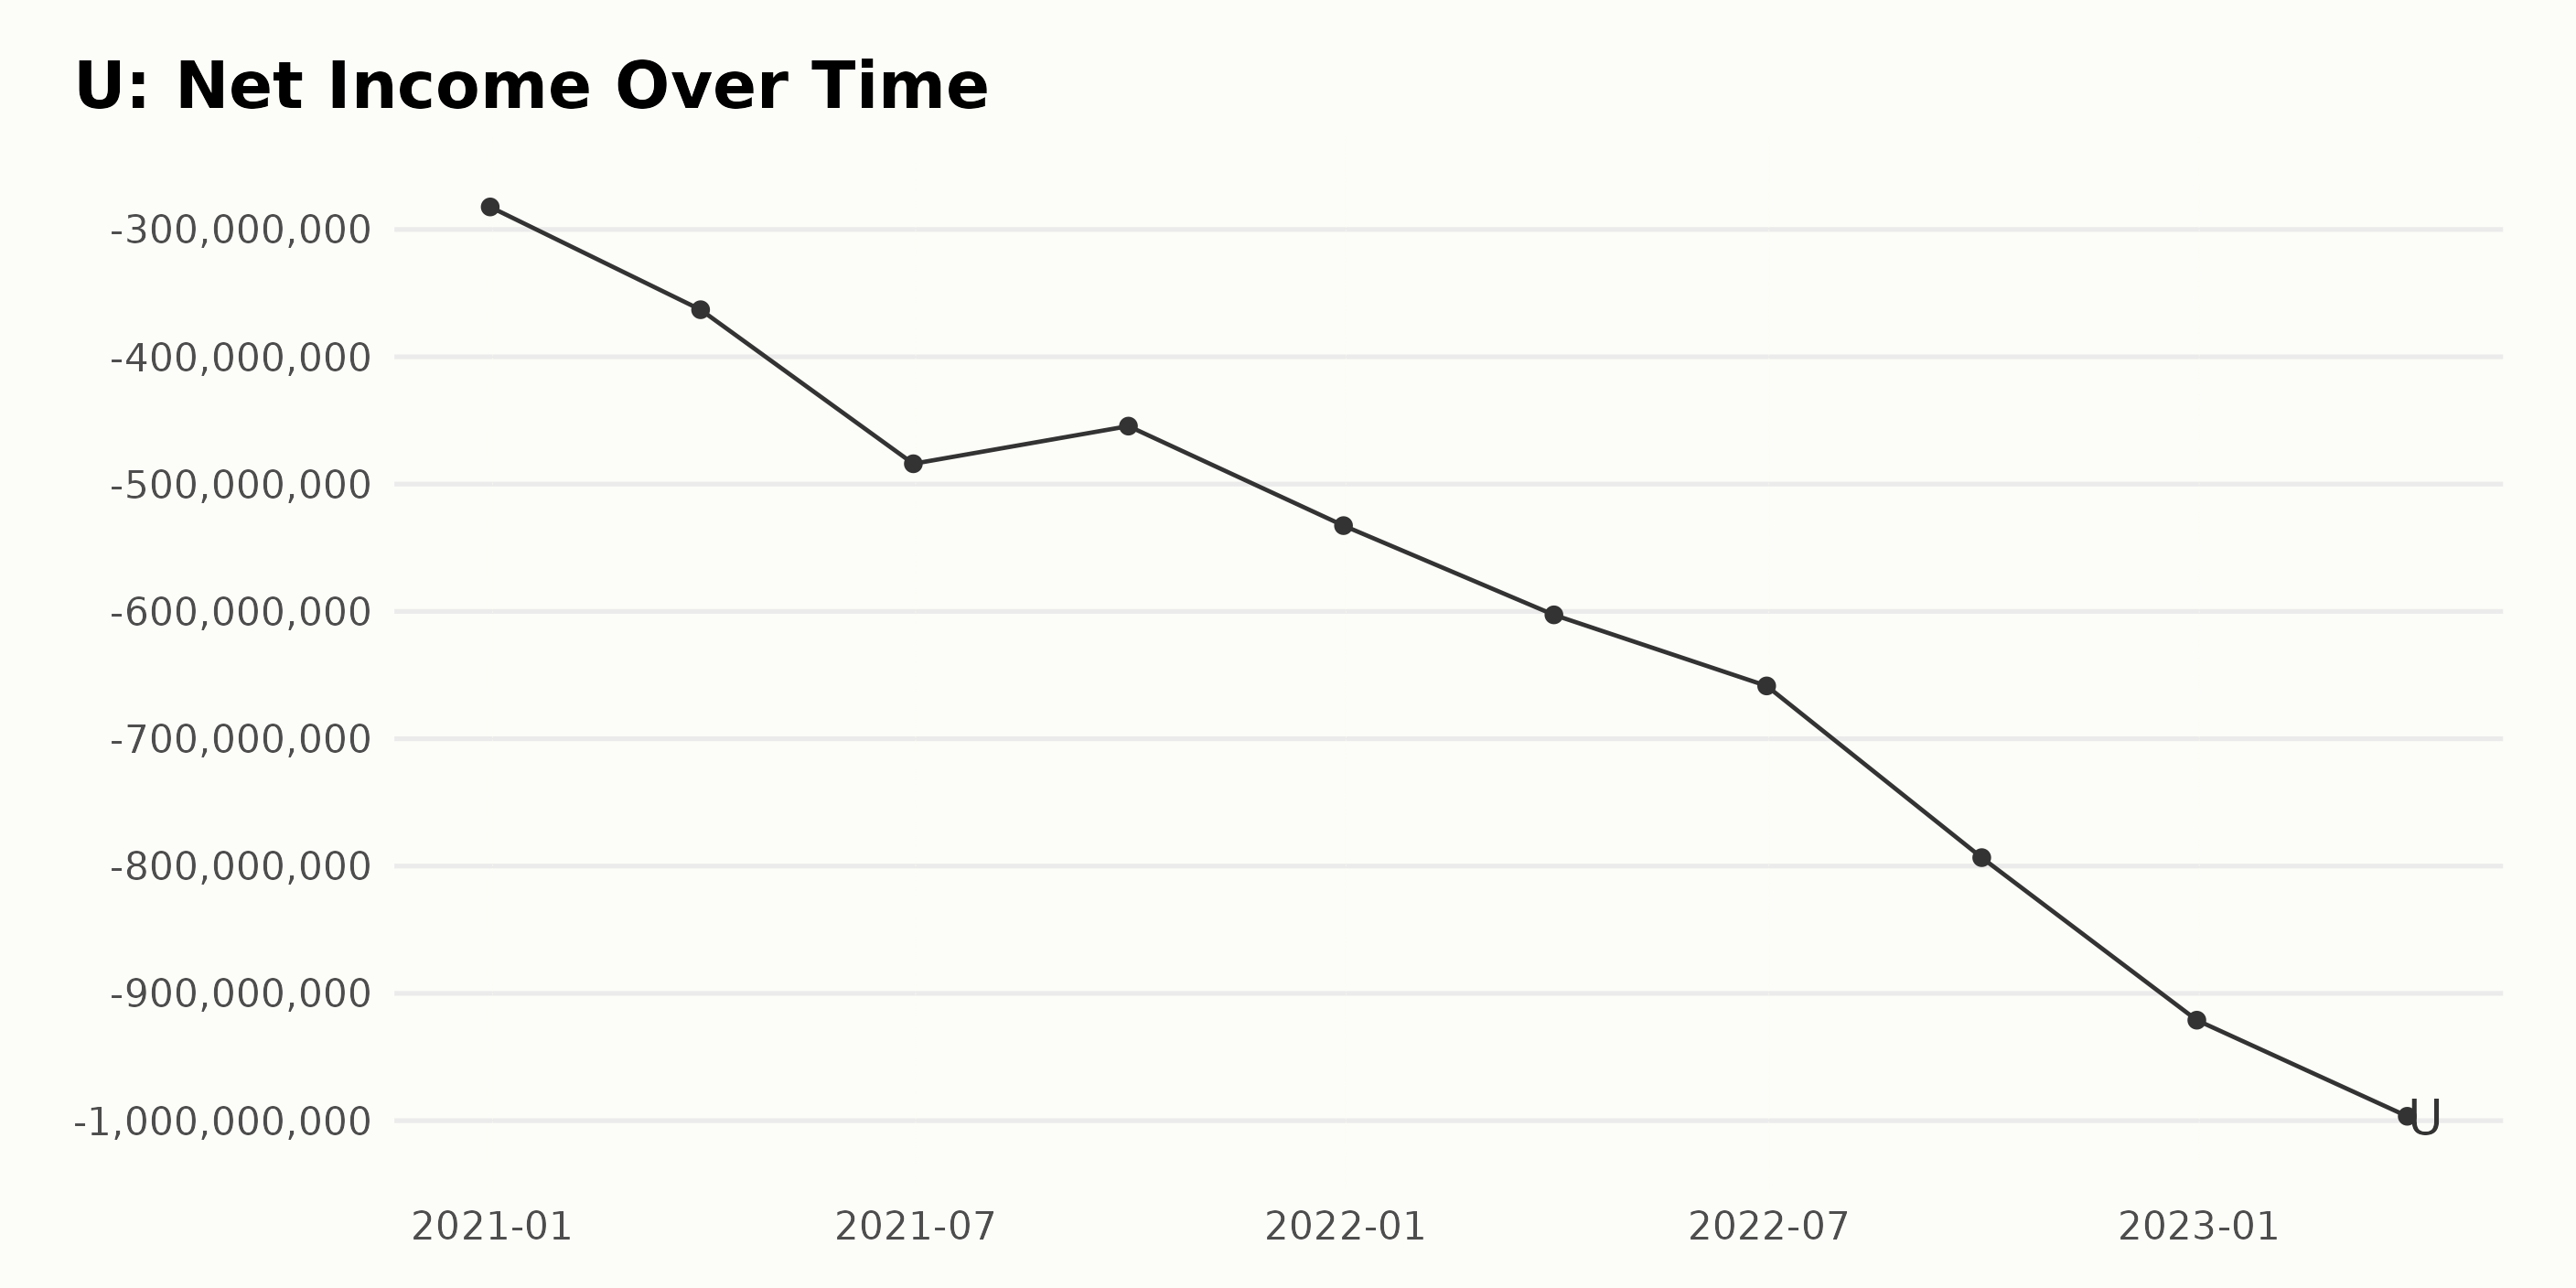
U’s trailing-12-month net income shows a consistently negative trend from December 2020 to March 2023. Let's highlight some key data points for a better understanding:
- As of December 2020, the net income stood at -$282.31 million.
- By March 2021, the net income dropped even further to -$363.03 million.
- In the following quarters, the negative net income gradually increased. As of June 2021, it was -$484.02 million, September 2021 reflected -$454.46 million, and by the end of December 2021, the value was -$532.61 million.
- In the first quarter of 2022, the net income had fallen to -$602.70 million. It continued to fall and reached -$658.52 million by the second quarter and further down to -$793.39 million in the third quarter of 2022.
- By the end of 2022, the downward trend pushed the net income to -$921.06 million.
- The last available data from March 2023 show that the net income has increased its loss to -$996.54 million.
Hence, the company experienced an expanded loss over this period from -$282.31 million in December 2020 to -$996.54 million in March 2023. This means the net income fell by approximately $714.23M, indicating a significant decline in the company's financial performance with a calculated compound growth decline rate of over 250%.
The rising negative net income reflects a weakening financial condition of the company across these years. Emphasizing more recent data, there is an escalating negative trend in 2022 and the first quarter of 2023, which signals a pressurized financial disposition of the company.
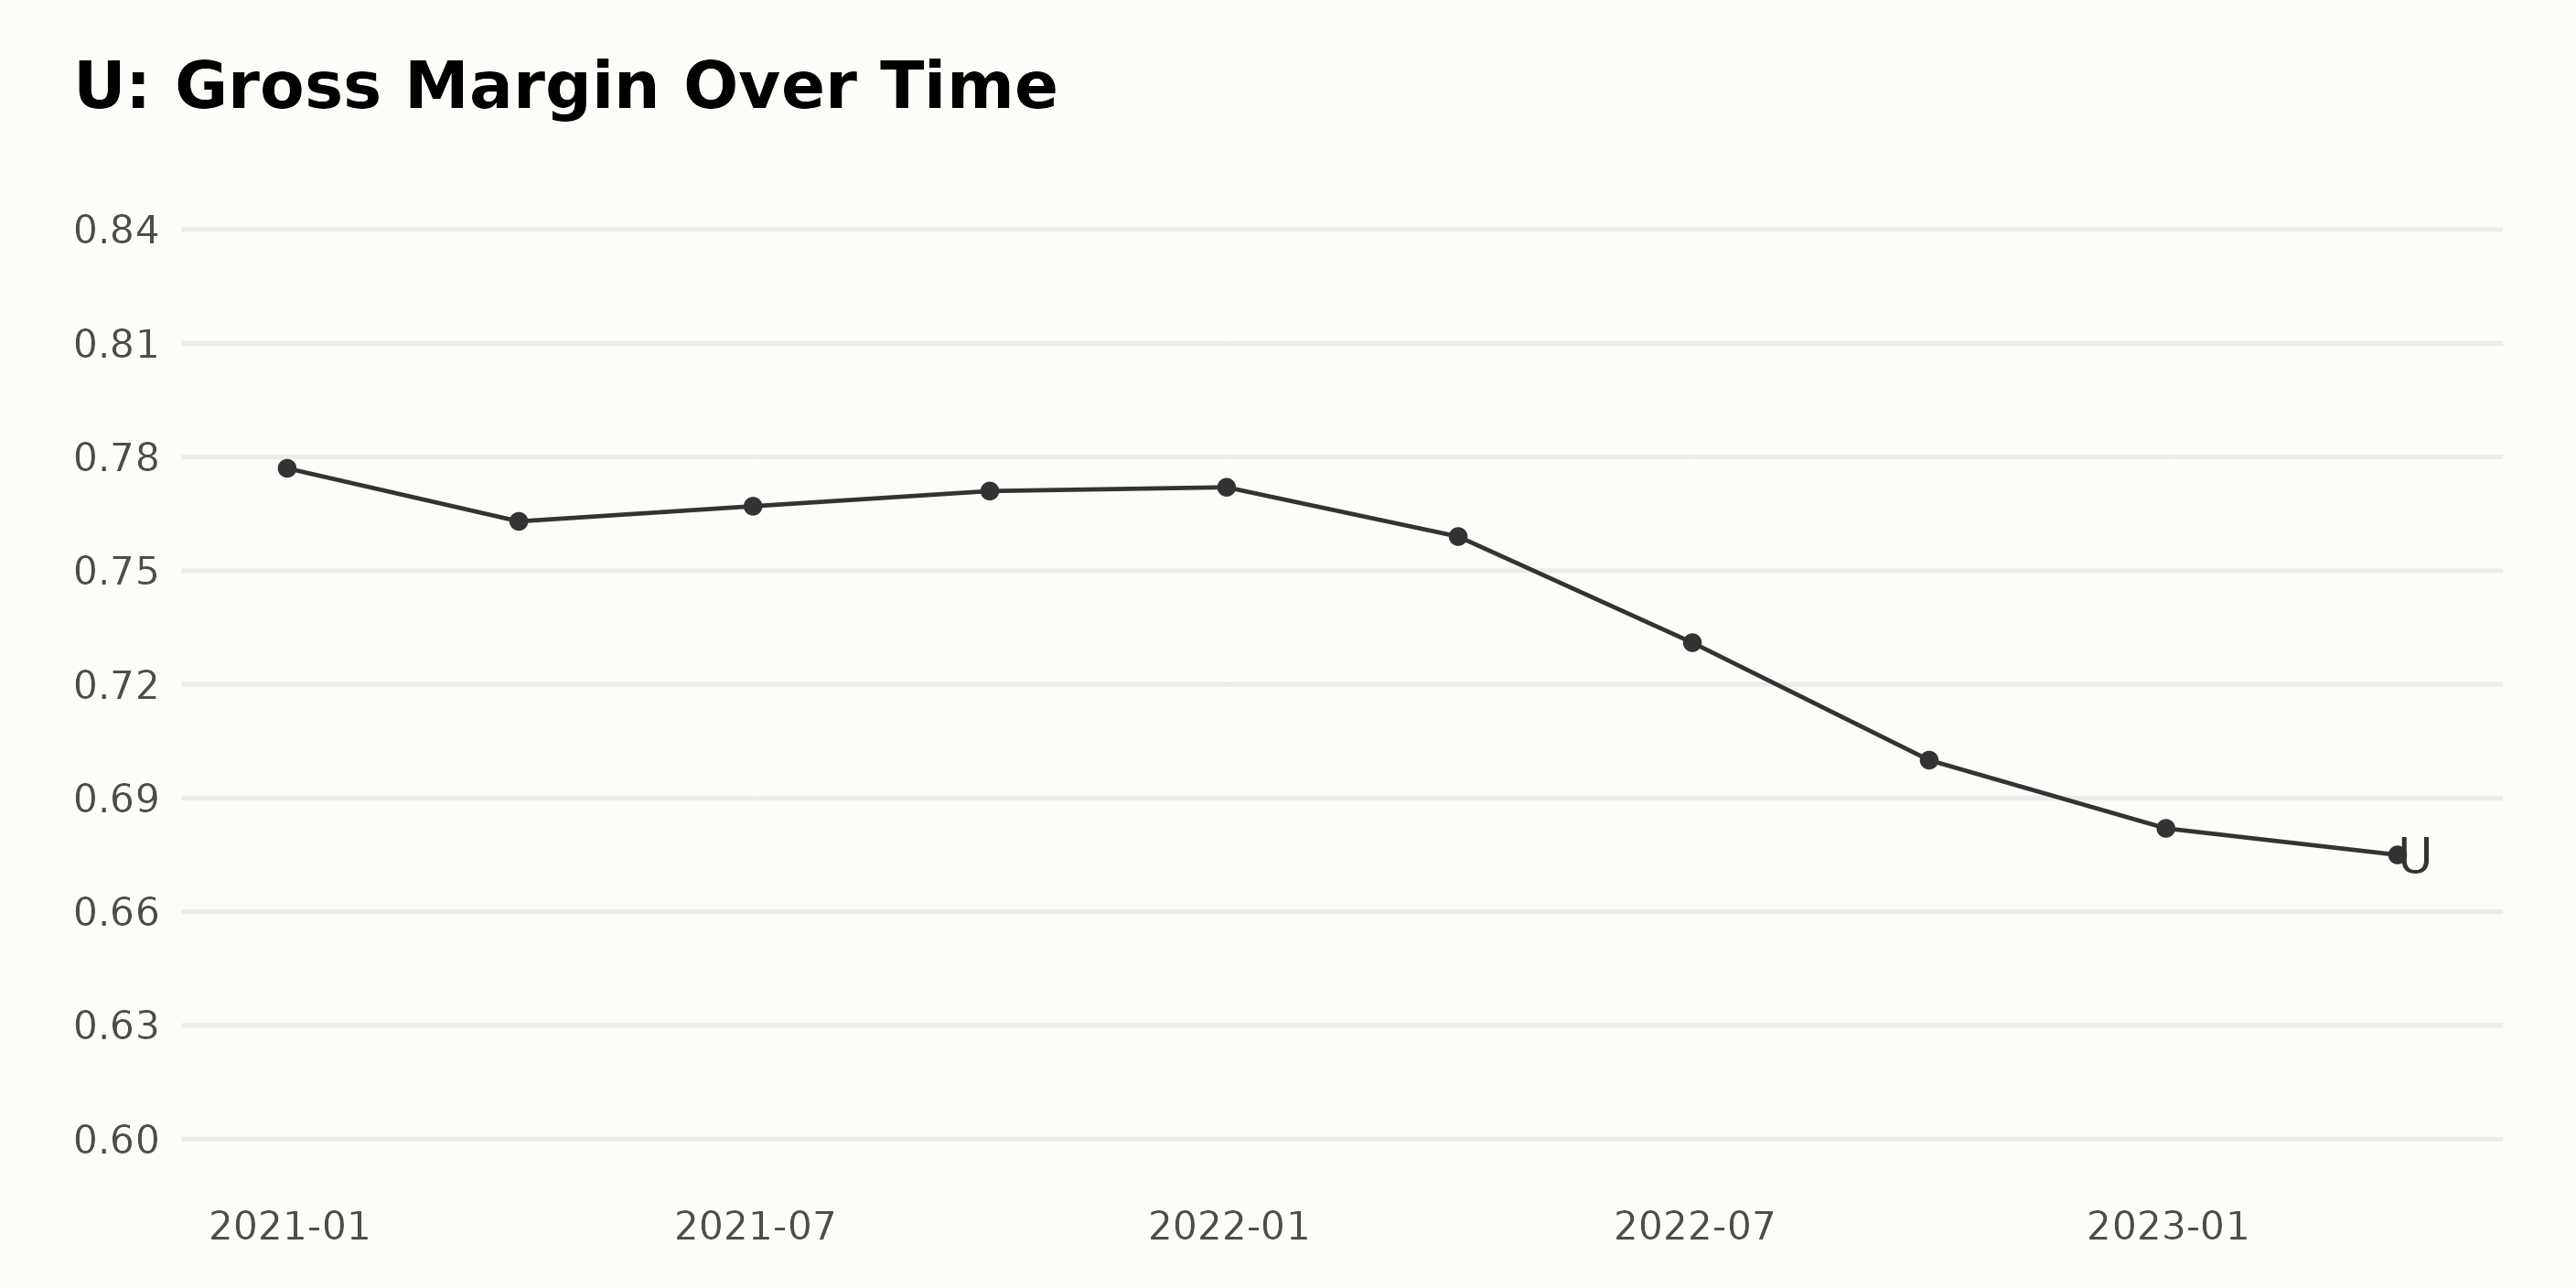
Here's a summary of the gross margin trend and fluctuation for Unity Software:
- December 31, 2020: The gross margin was 77.70%.
- March 31, 2021: A slight decrease was seen with a gross margin of 76.30%.
- June 30, 2021: The gross margin again increased to 76.70%.
- September 30, 2021: A slight increase is tracked at 77.10%.
- December 31, 2021: Marginal growth is recorded, the gross margin being 77.20%.
- March 31, 2022: A significant downturn brings the gross margin down to 75.90%.
- June 30, 2022: Another considerable drop was registered, the gross margin being 73.10%.
- September 30, 2022: The trend continues with yet another decline, the gross margin landing at 70.00%.
- December 31, 2022: Further decline is observed, with the gross margin showing 68.20%.
- March 31, 2023: The last value in the series shows a gross margin of 67.50%, illustrating the continuation of the descending trend.
Looking at the first and last values, the gross margin decreased from 77.70% as of December 31, 2020, to 67.50% as of March 31, 2023, which indicates a negative growth rate of 13.14% over this period.
Recent data presents a downward trend in U’s gross margin. This trend emphasizes that the more recent years have seen a definitive decline, culminating in the March 31, 2023, value of 67.50%.
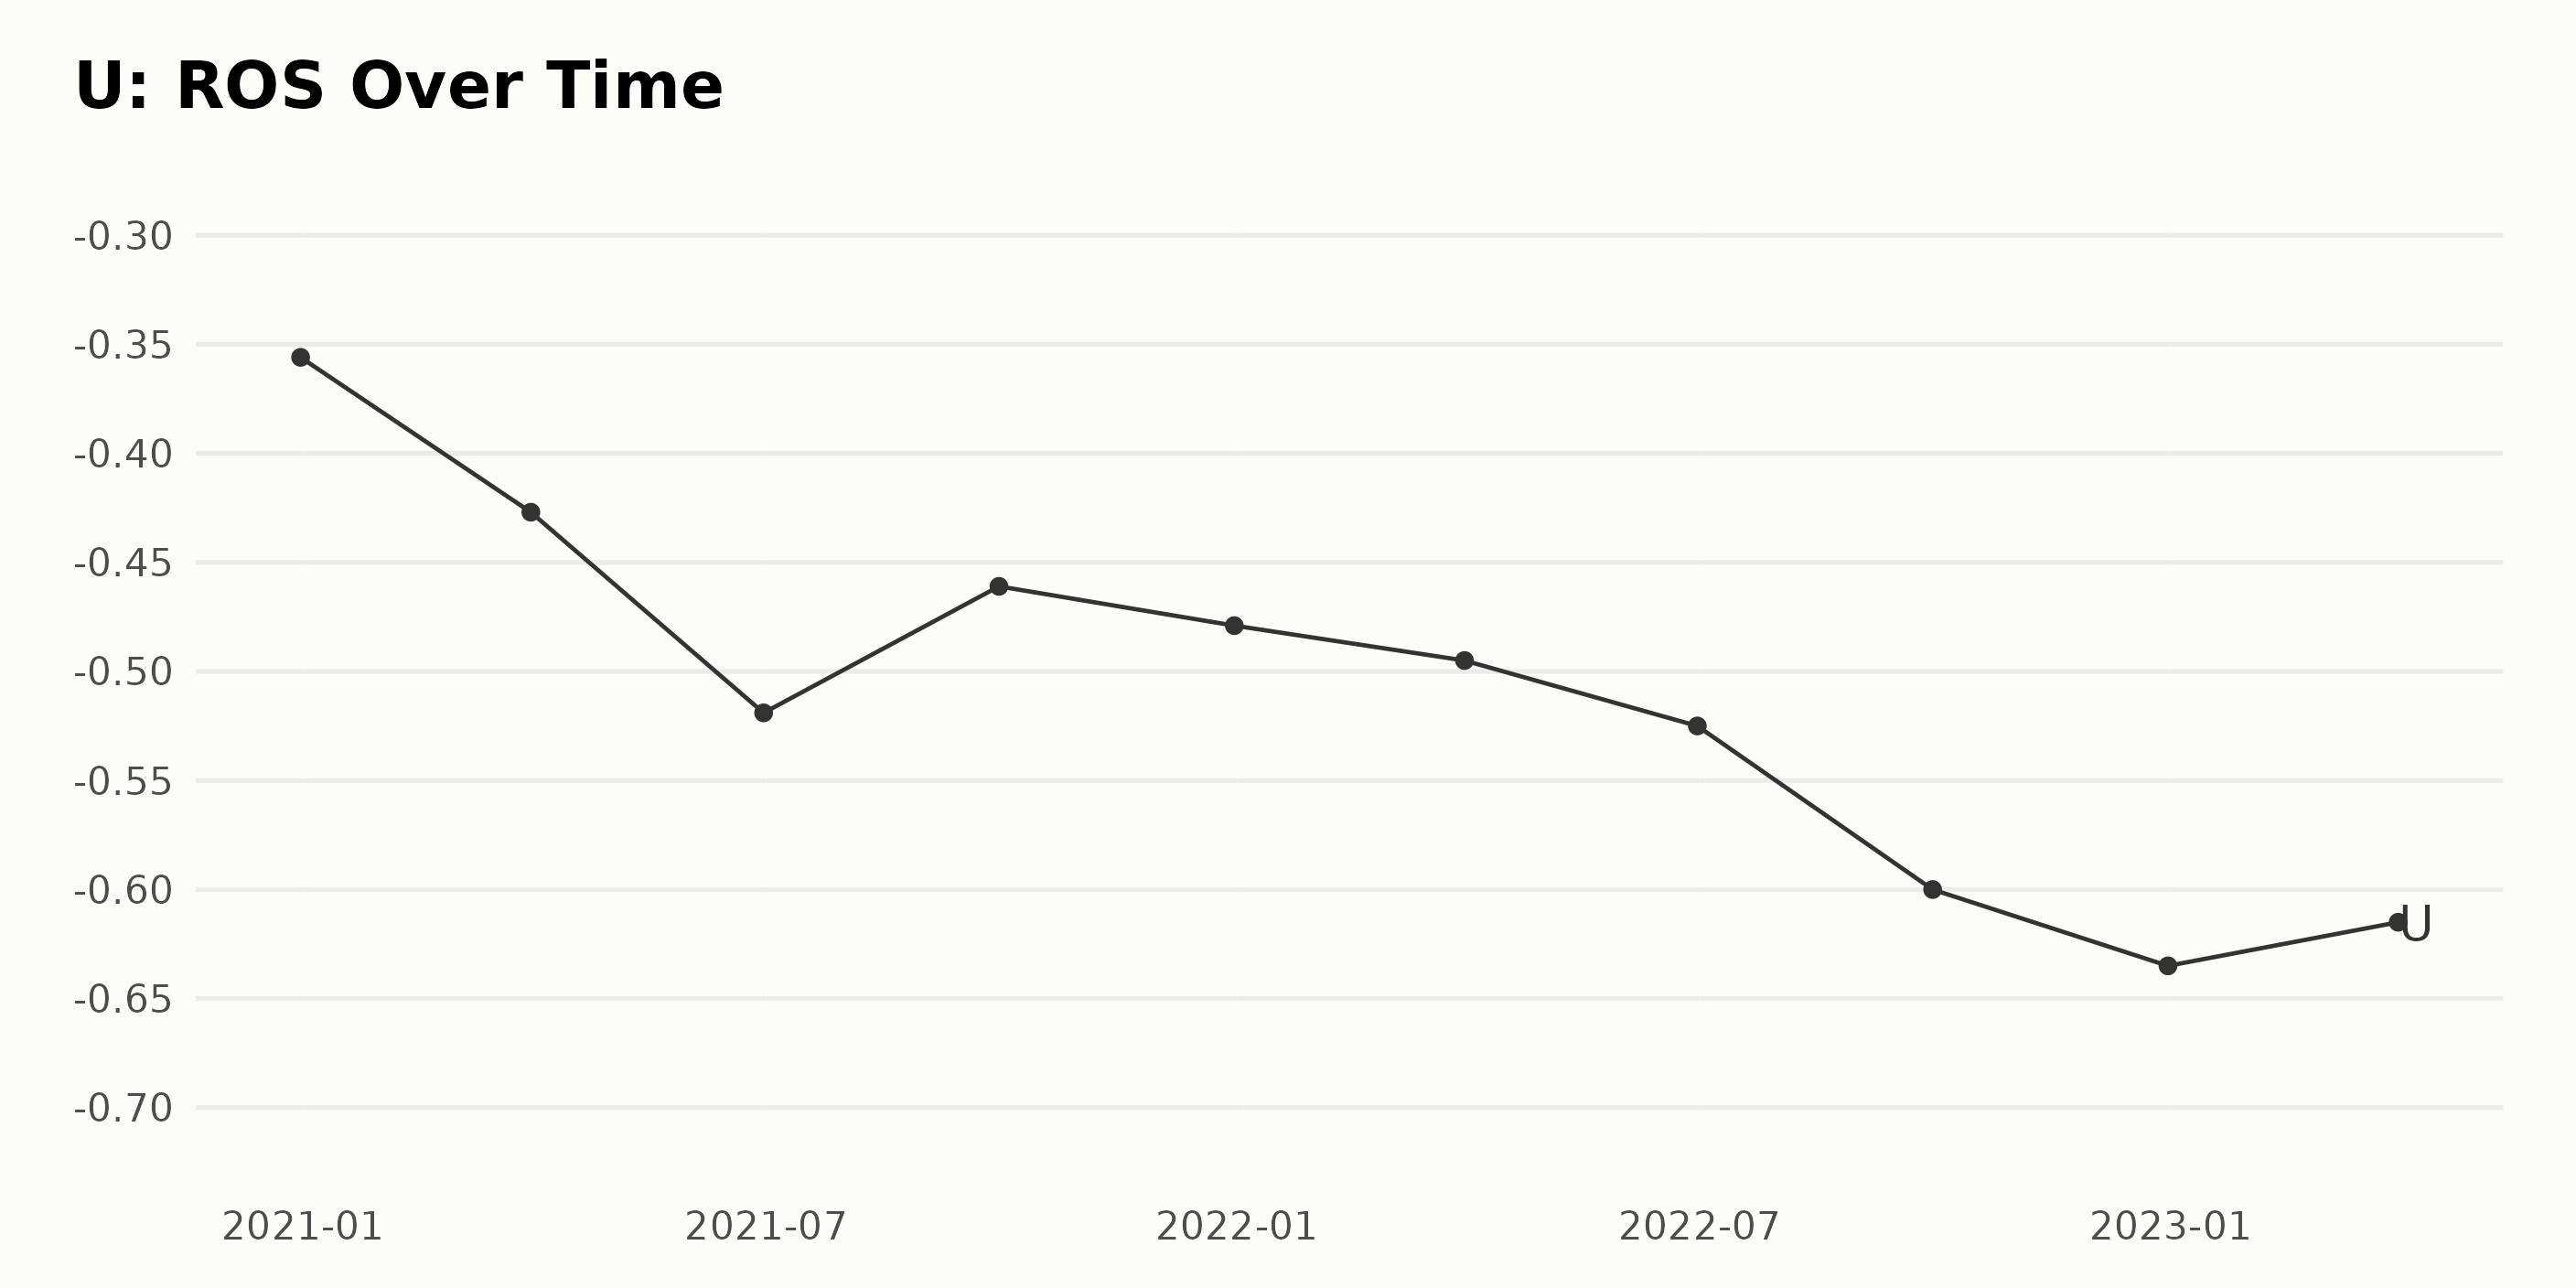
The following is the summarized trend and fluctuations of U’s Return On Sales (ROS):
- As of December 31, 2020, the ROS stood at -0.36.
- Throughout 2021, there were fluctuations in the ROS, starting with a drop to -0.43 by March 31, 2021. It continued to fall to -0.52 by June 30, slightly recovered to -0.46 by September 30 but then dropped again to -0.48 by the end of the year- December 31, 2021.
- However, in 2022, there was a consistent decline in the ROS. It began with -0.50 by March 31, further falling to -0.53 by June 30. A sharp drop was noticed to -0.60 by September 30, ending the year at -0.64 as of December 31, 2022.
- As of the most recent measure, March 31, 2023, ROS slightly recovered to -0.62.
The calculated growth rate from the first value (December 31, 2020) to the last value (March 31, 2023) is negative. This indicates an overall downward trend in ROS, implying a growth rate drop of approximately 73% over this period. Emphasizing the more recent data, there are indications of a substantial negative trend with a slight recovery in the last quarter.
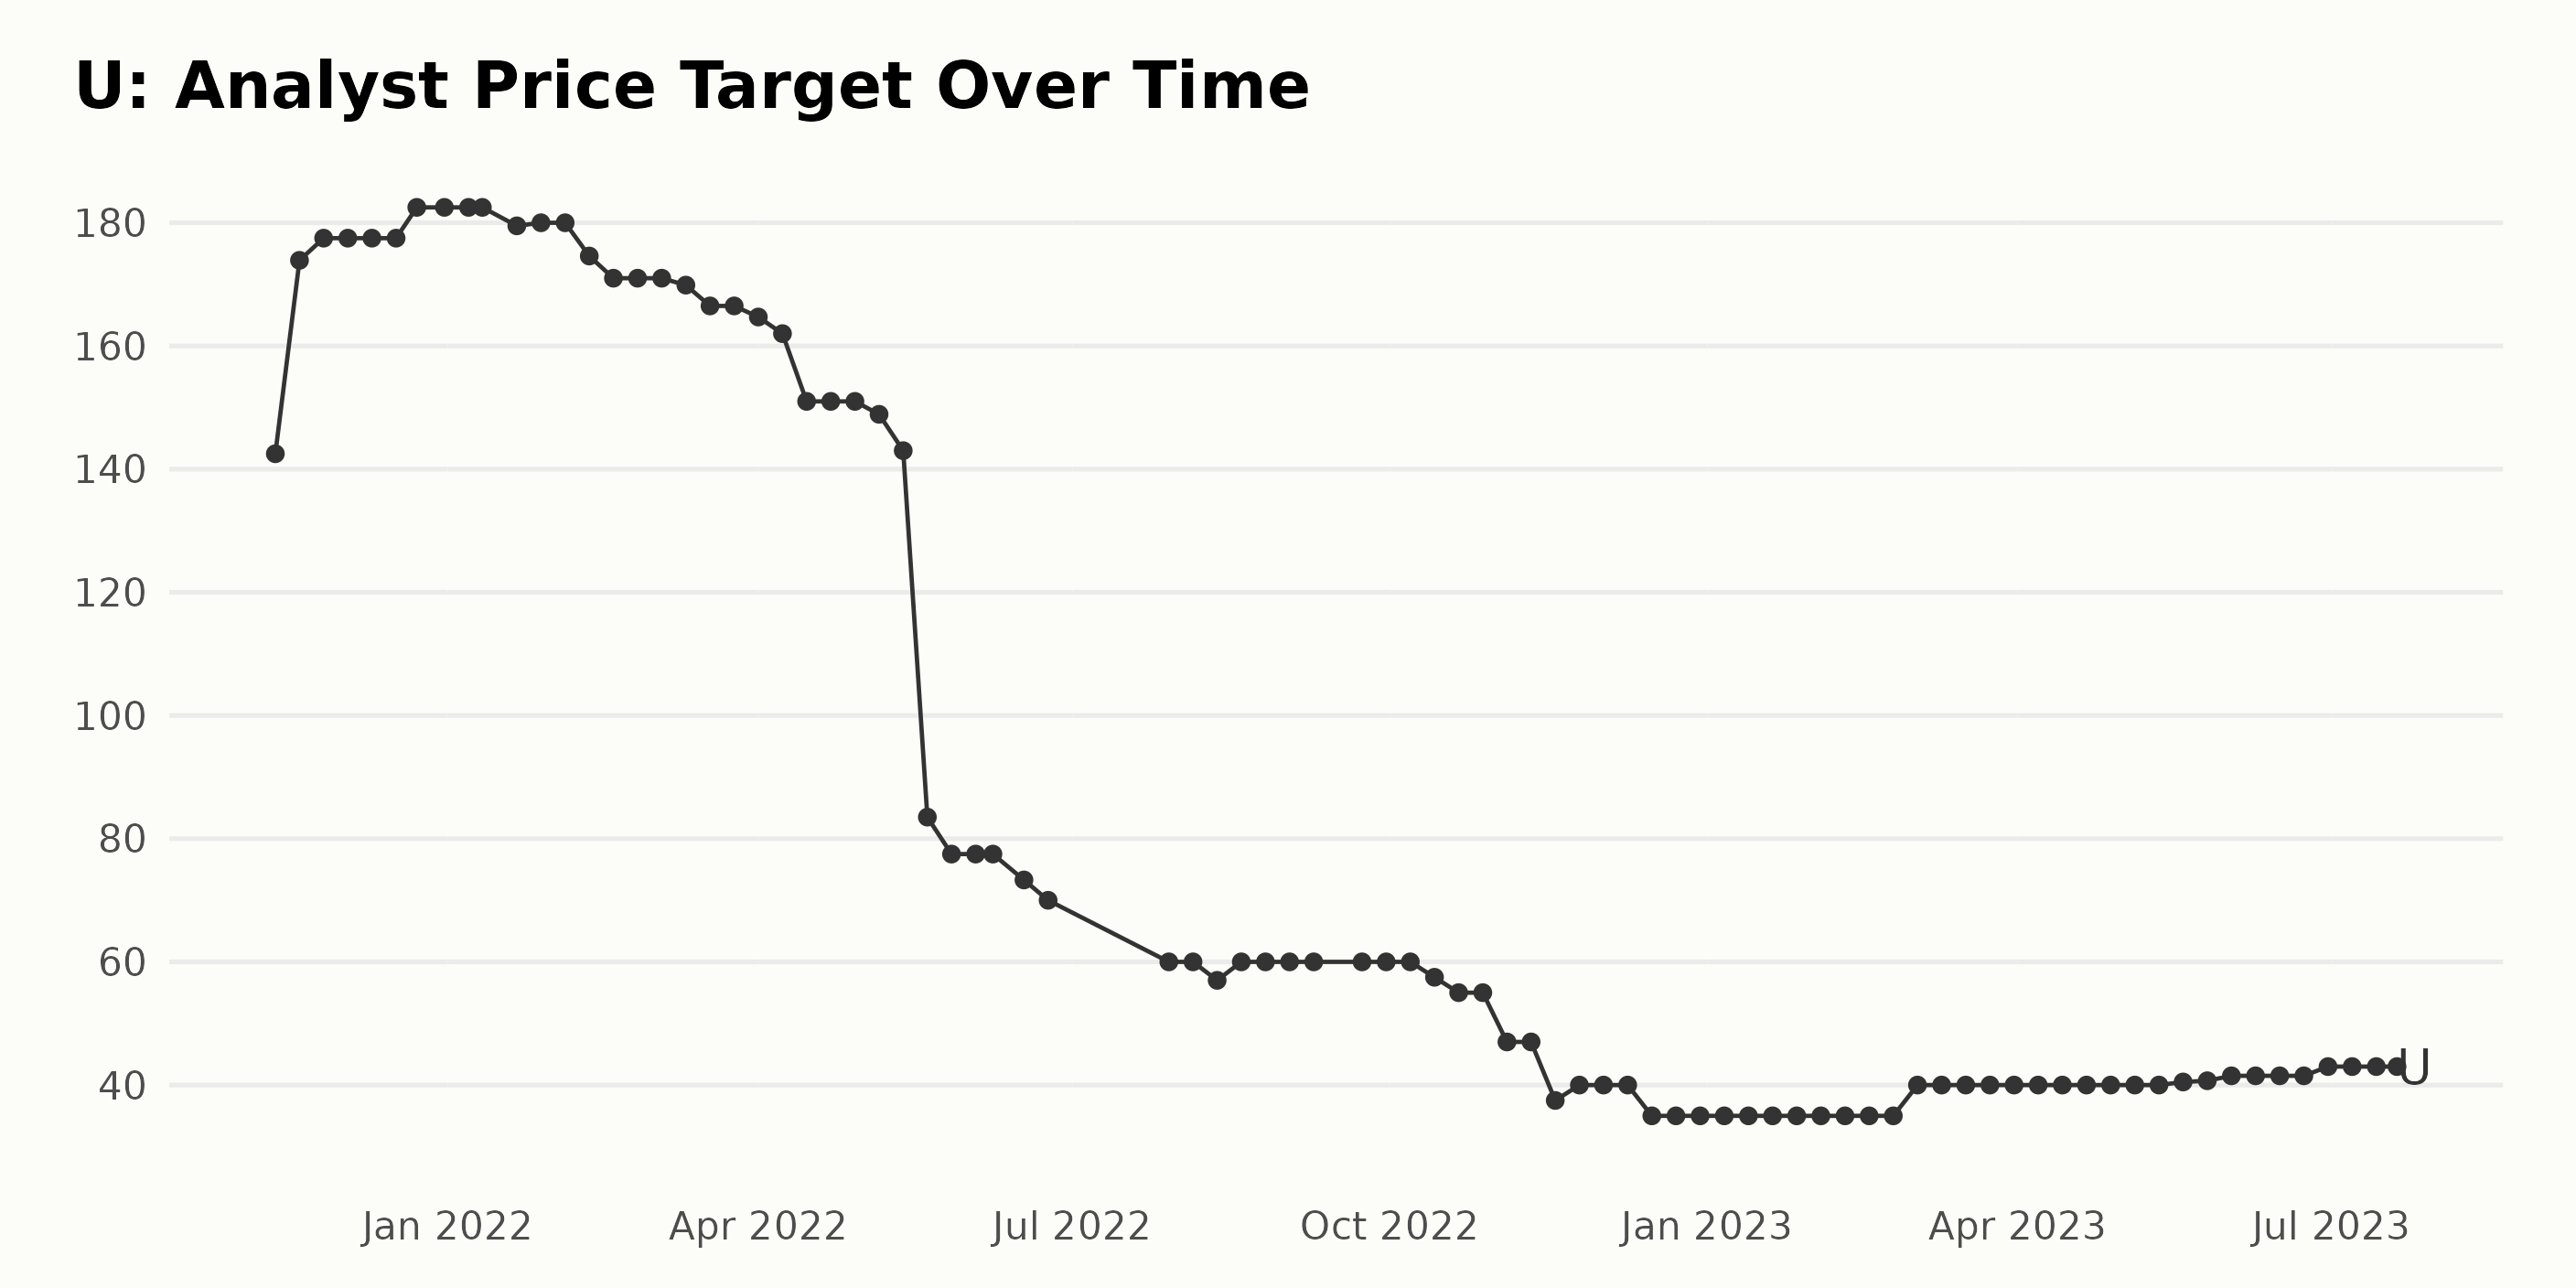
The analyst price target for Unity Software underwent significant fluctuations between November 2021 and July 2023. Here are the key points based on the provided series of data:
- From November 12, 2021, to December 23, 2021, an evident increase was observed in the price target. It rose from $142.5 to reach its peak of $182.5.
- The value remained stable at around $180 until early February 2022 before it gradually declined, with occasional recoveries.
- A sharp drop was seen in May 2022, when the value plummeted to $83.5 from $143 within a week.
- Following this period, the price steadily declined until November 2022, when it reached its low of $35.
- From December 2022, the analyst price target remained steady around the $35 mark till February 2023.
- After that, starting in March 2023, a steady upward tendency can be observed, eventually reaching $43 by the end of June 2023.
The overall growth rate of U’s analyst price target from November 2021 to July 2023, measured by comparing the last value ($43) with the first value ($142.5), indicates a decrease of approximately 70%.
More recent data, especially the latter half of the series, suggests a stabilizing trend with signs of a modest recovery. The immediate future trends for U’s analyst price target should focus on whether it maintains this recovery or reverts to previous declines.
Analyzing Unity Software Stock Performance Trends in the First Half of 2023
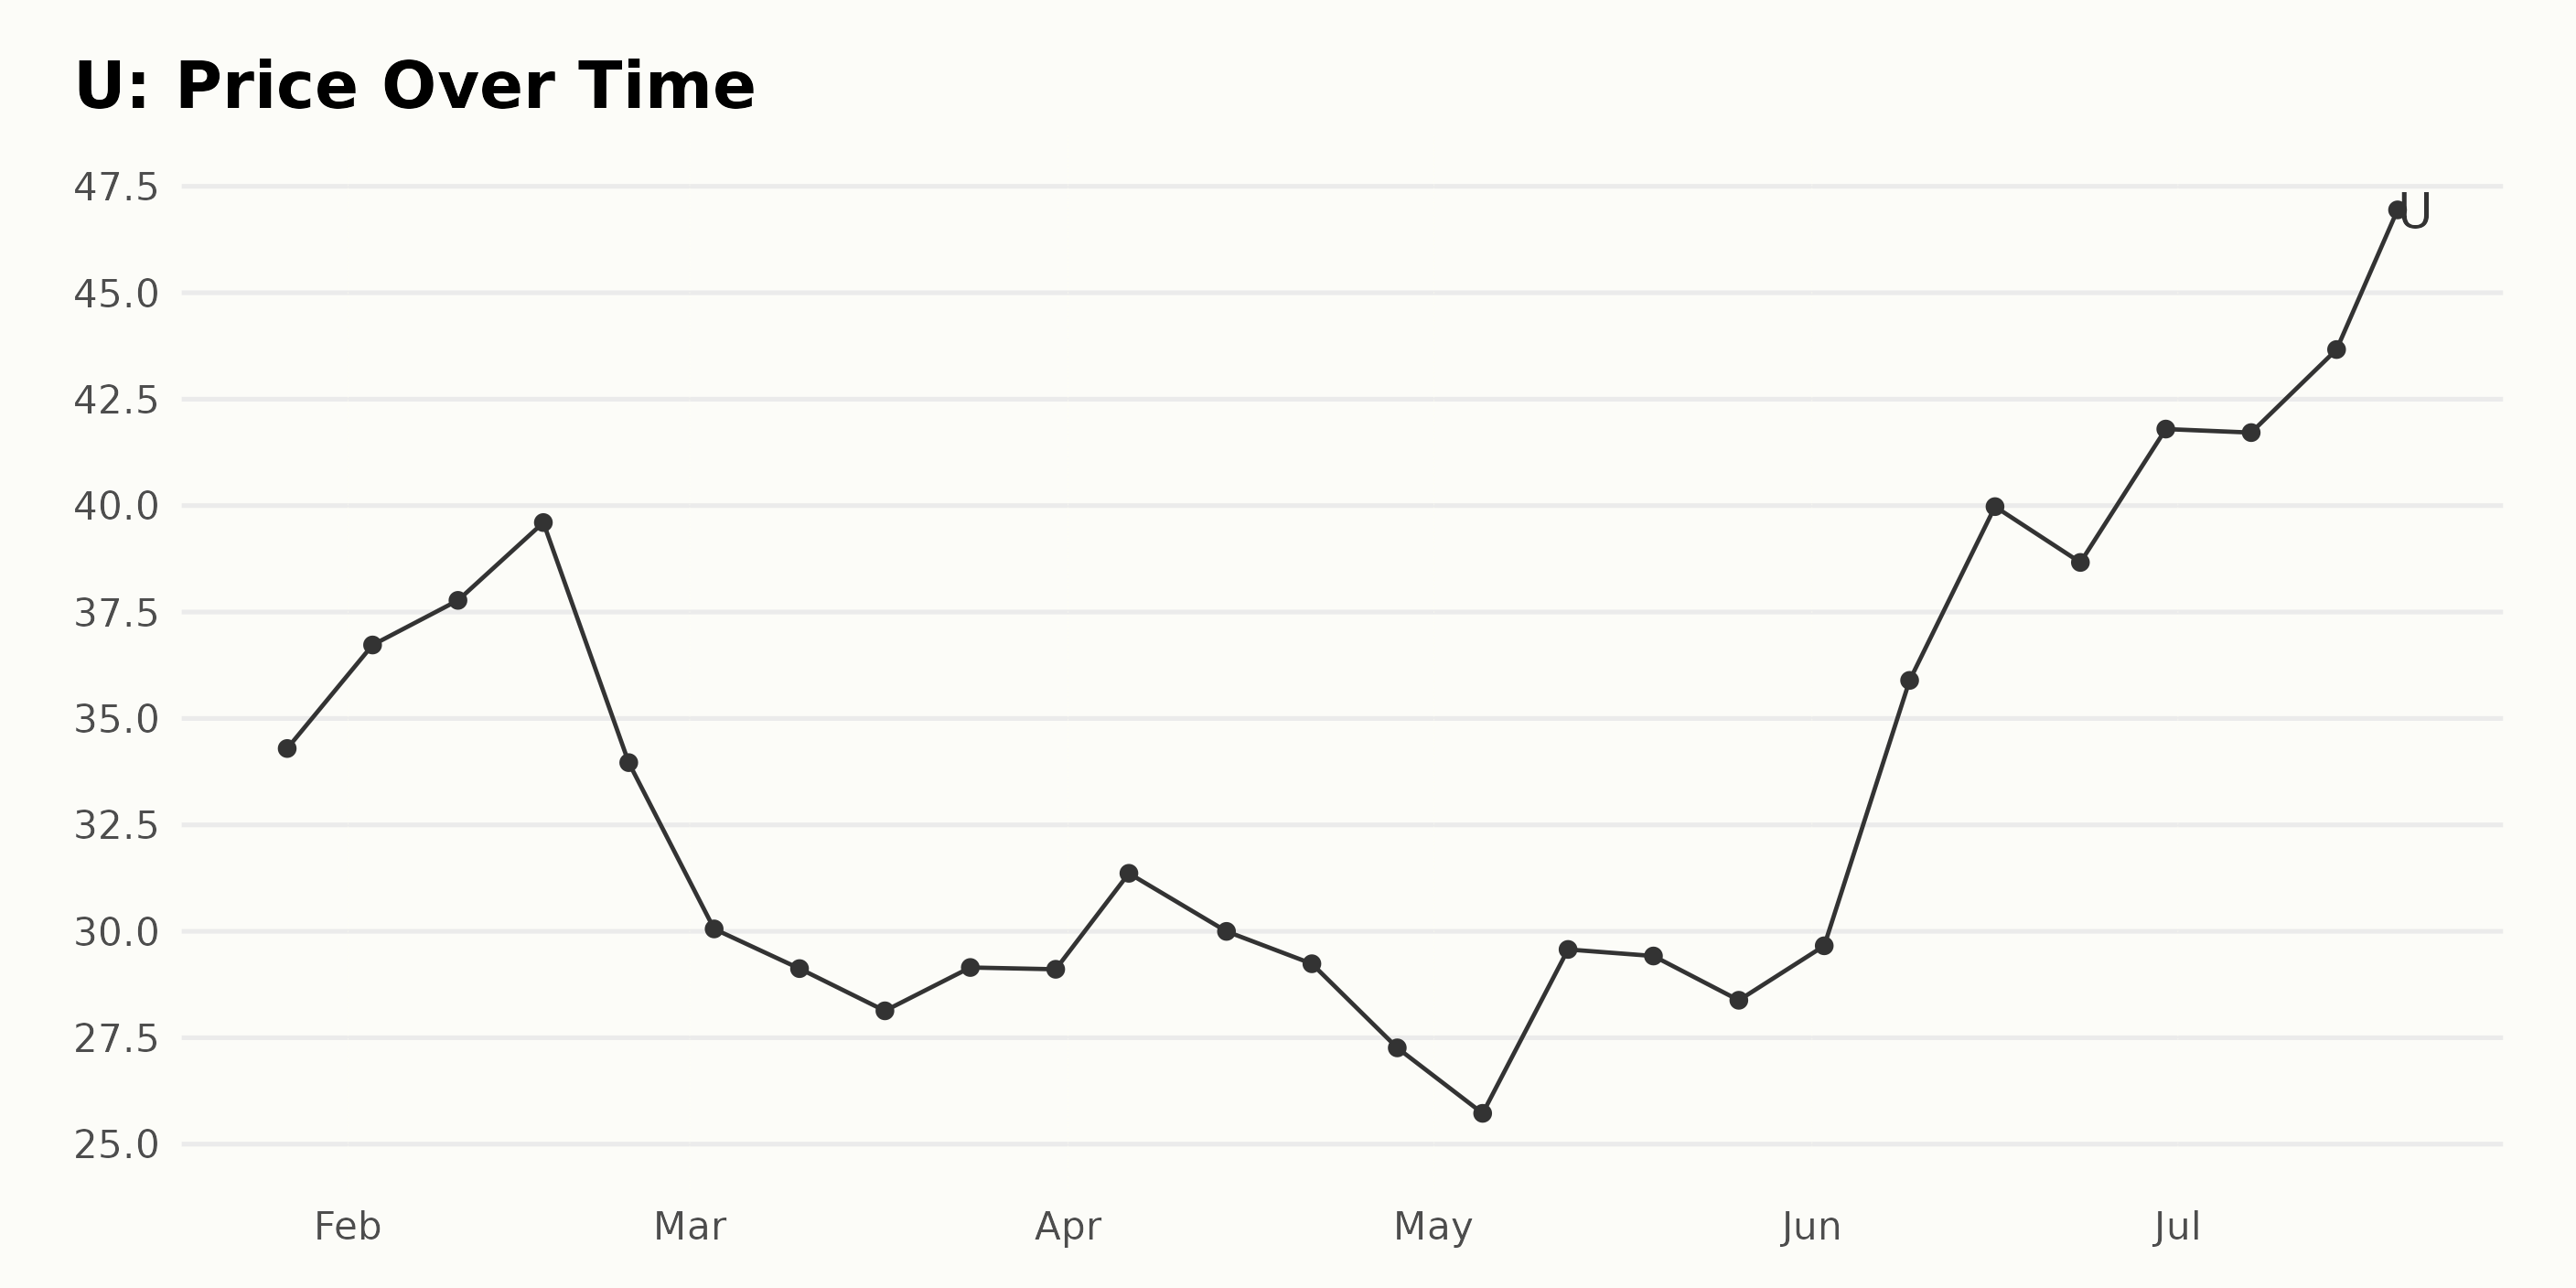
The trend and growth rate of the data can be outlined as follows:
- On January 27, 2023, U’s price was $34.29.
- The price then increased consecutively over the following three weeks to a peak of $39.60 by February 17, 2023.
- However, a decelerating trend was observed from the last week of February to the end of March, with the price declining to a low of $28.13 on March 17, 2023.
- A short increase was seen at the end of March, peaking at $31.36 on April 6, 2023, before decreasing again to $27.26 by the end of April.
- In May, the prices fluctuated without a clear trend ending at $28.38 by the end of the month.
- Starting in June, an accelerating upward trend is observed. The price increased almost constantly to $48.50 by July 19, 2023.
Therefore, despite some short-term decreases, the overall trend of the share price has been growing from the start of 2023 till mid-July 2023. The first half of the year had some volatility, but the price seems to have stabilized and shown consistent growth in the second part of the year so far. Here is a chart of U's price over the past 180 days.
Significant Growth, Momentum, and Sentiment Improvement for Unity Software Stock in 2023
Based on the data provided, the latest POWR Ratings grade value for the stock U, which falls under the Entertainment - Toys & Video Games category, as of July 20, 2023, is D (Sell).
In terms of its position relative to the overall category, it embodies the #14 rank out of a total of 19 stocks. This ranking positions the company relatively low within this category. Here's a summary of the evolution of U’s performance from January to July 2023:
- January 21, 2023: POWR Grade was F (Strong Sell), ranked #19.
- February 4, 2023: POWR Grade continued to be F (Strong Sell) with a rank of #19.
- February 11, 2023: POWR Grade was still F (Strong Sell). However, it slipped further in rank to #20.
- March 3, 2023: POWR Grade improved slightly to D (Sell), with a rank of #16.
- April 15 to April 29, 2023: Despite maintaining the D (Sell) POWR Grade, the stock returned to the #18 rank.
- May 6, 2023: Maintained the D (Sell) grade but slipped to a rank of #19.
- May 27, 2023: Showed promise with an improved rank of #14 while keeping the D (Sell) grade.
- June 3 to June 24, 2023: Experienced fluctuations in the ranking, ranging between #14 and #17, with a constant D (Sell) grade.
- July 1 to July 20, 2023: POWR Grade remained at D (Sell) but gradually improved in ranking, securing the #14 spot by mid-July.
While the company has performed slightly better over time, the low POWR Grade and its ranking within its category indicate room for potential improvement.
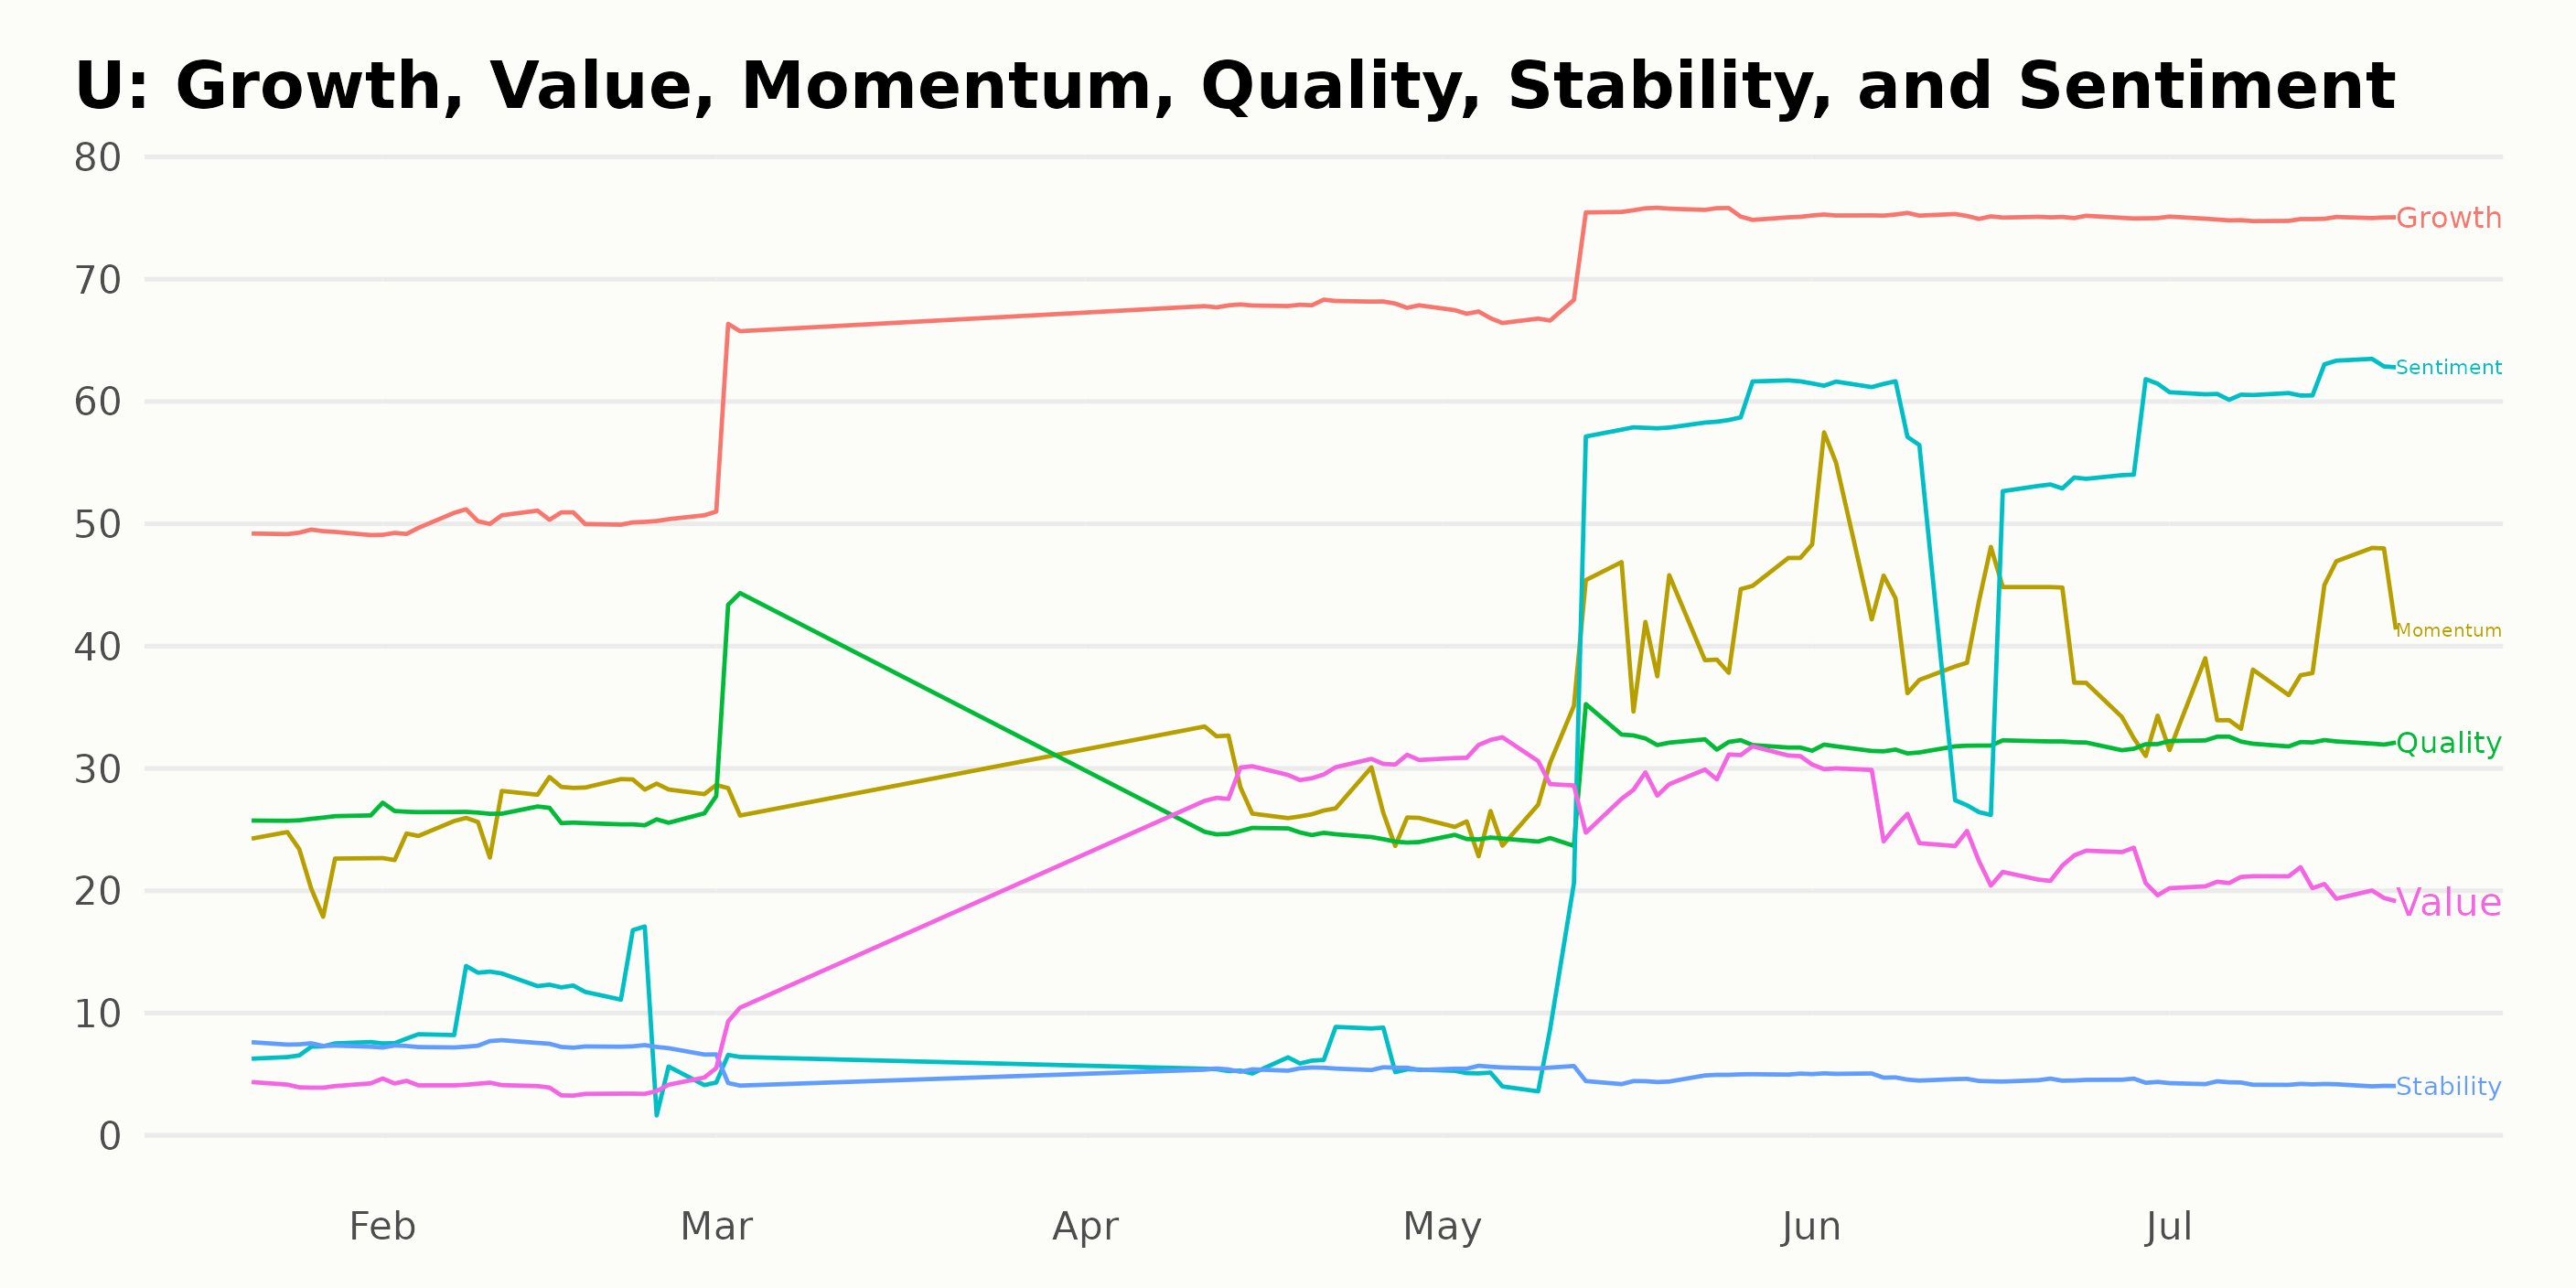
Based on the POWR Ratings provided, U’s three most noteworthy dimensions are Growth, Momentum, and Sentiment. This analysis focuses on these three key dimensions.
Growth:
From January 2023 to July 2023, U has shown significant improvement in its Growth dimension:
- January 2023: The Growth rating was 49.
- By April 2023, this value increased substantially to 68.
- By July 2023, U's Growth rating peaked at 75, indicating an overall positive growth trend.
Momentum:
The Momentum aspect also saw an upward trend in the same period:
- In January 2023, the Momentum rating was relatively low at 22.
- There was a consistent increase reaching up to 42 by June 2023.
- A slight decline was observed, with a rating of 39 in July 2023.
Sentiment:
In terms of Sentiment, U had an impressive upward trajectory throughout the period:
- Starting from a very low sentiment rating of 7 in January 2023,
- the score spiked to a substantial 61 by July 2023.
These findings indicate that U made solid progress across several key dimensions over the first half of 2023.
How does Unity Software Inc. (U) Stack Up Against its Peers?
Other stocks in the Entertainment - Toys & Video Games sector that may be worth considering are Sega Sammy Holdings Inc. (SGAMY), Playtika Holding Corp. (PLTK), and Gravity Co., Ltd. (GRVY) - they have better POWR Ratings.
43 Year Investment Pro Shares Top Picks
Steve Reitmeister is best known for his timely market outlooks & unique trading plans to stay on the right side of the market action. Click below to get his latest insights…
Steve Reitmeister’s Trading Plan & Top Picks >
U shares were trading at $45.10 per share on Thursday afternoon, down $3.40 (-7.01%). Year-to-date, U has gained 57.75%, versus a 19.52% rise in the benchmark S&P 500 index during the same period.
About the Author: Anushka Dutta

Anushka is an analyst whose interest in understanding the impact of broader economic changes on financial markets motivated her to pursue a career in investment research.
The post Should Unity Software (U) Be on Your Watchlist? appeared first on StockNews.com