
Qualcomm Incorporated (QCOM), famed for manufacturing chips and modems embedded in Android phones, is assertively aiming to carve a niche for itself in the sphere of artificial intelligence. Recent pronouncements by the company underline this ambition, with novel developments such as in-vehicle generative AI capabilities, expansion into two-wheeler markets, and an exciting new collaboration with Amazon Web Services.
In recent years, QCOM has set its sights on broadening its footprint in the domain of automotive chips, a sector already buzzing with high-stake action from incumbent heavyweights. The increased competition in the car chip business poses a robust challenge to Qualcomm's plans.
The company had announced that it would acquire Autotalks, a maker of chips used in crash-prevention technology in vehicles, aiming to expand its automotive business. However, the deal is subjected to regulatory headwinds, as the EU regulators said that the U.S. chipmaker would have to seek antitrust approval for the planned takeover, while the U.S. Federal Trade Commission (FTC) is expected to open an in-depth probe into the deal.
On the other hand, on October 2, 2023, Alexander Rogers, President of QTL & Global Affairs at Qualcomm, sold 6,001 company shares. As part of a series of transactions spanning over a year, Rogers has offloaded 60,054 shares without making any purchases. With the past year witnessing ten insider transactions involving selling off shares and none involving purchases, this could arguably signify bearish sentiments toward the company.
Moreover, in light of its weak momentum over the recent months, I think this is not the right entry point in the stock. A detailed examination of its key metrics should shed further light on the matter.
Analyzing Fluctuations in Financial Metrics of QUALCOMM Inc. (2010-2023)
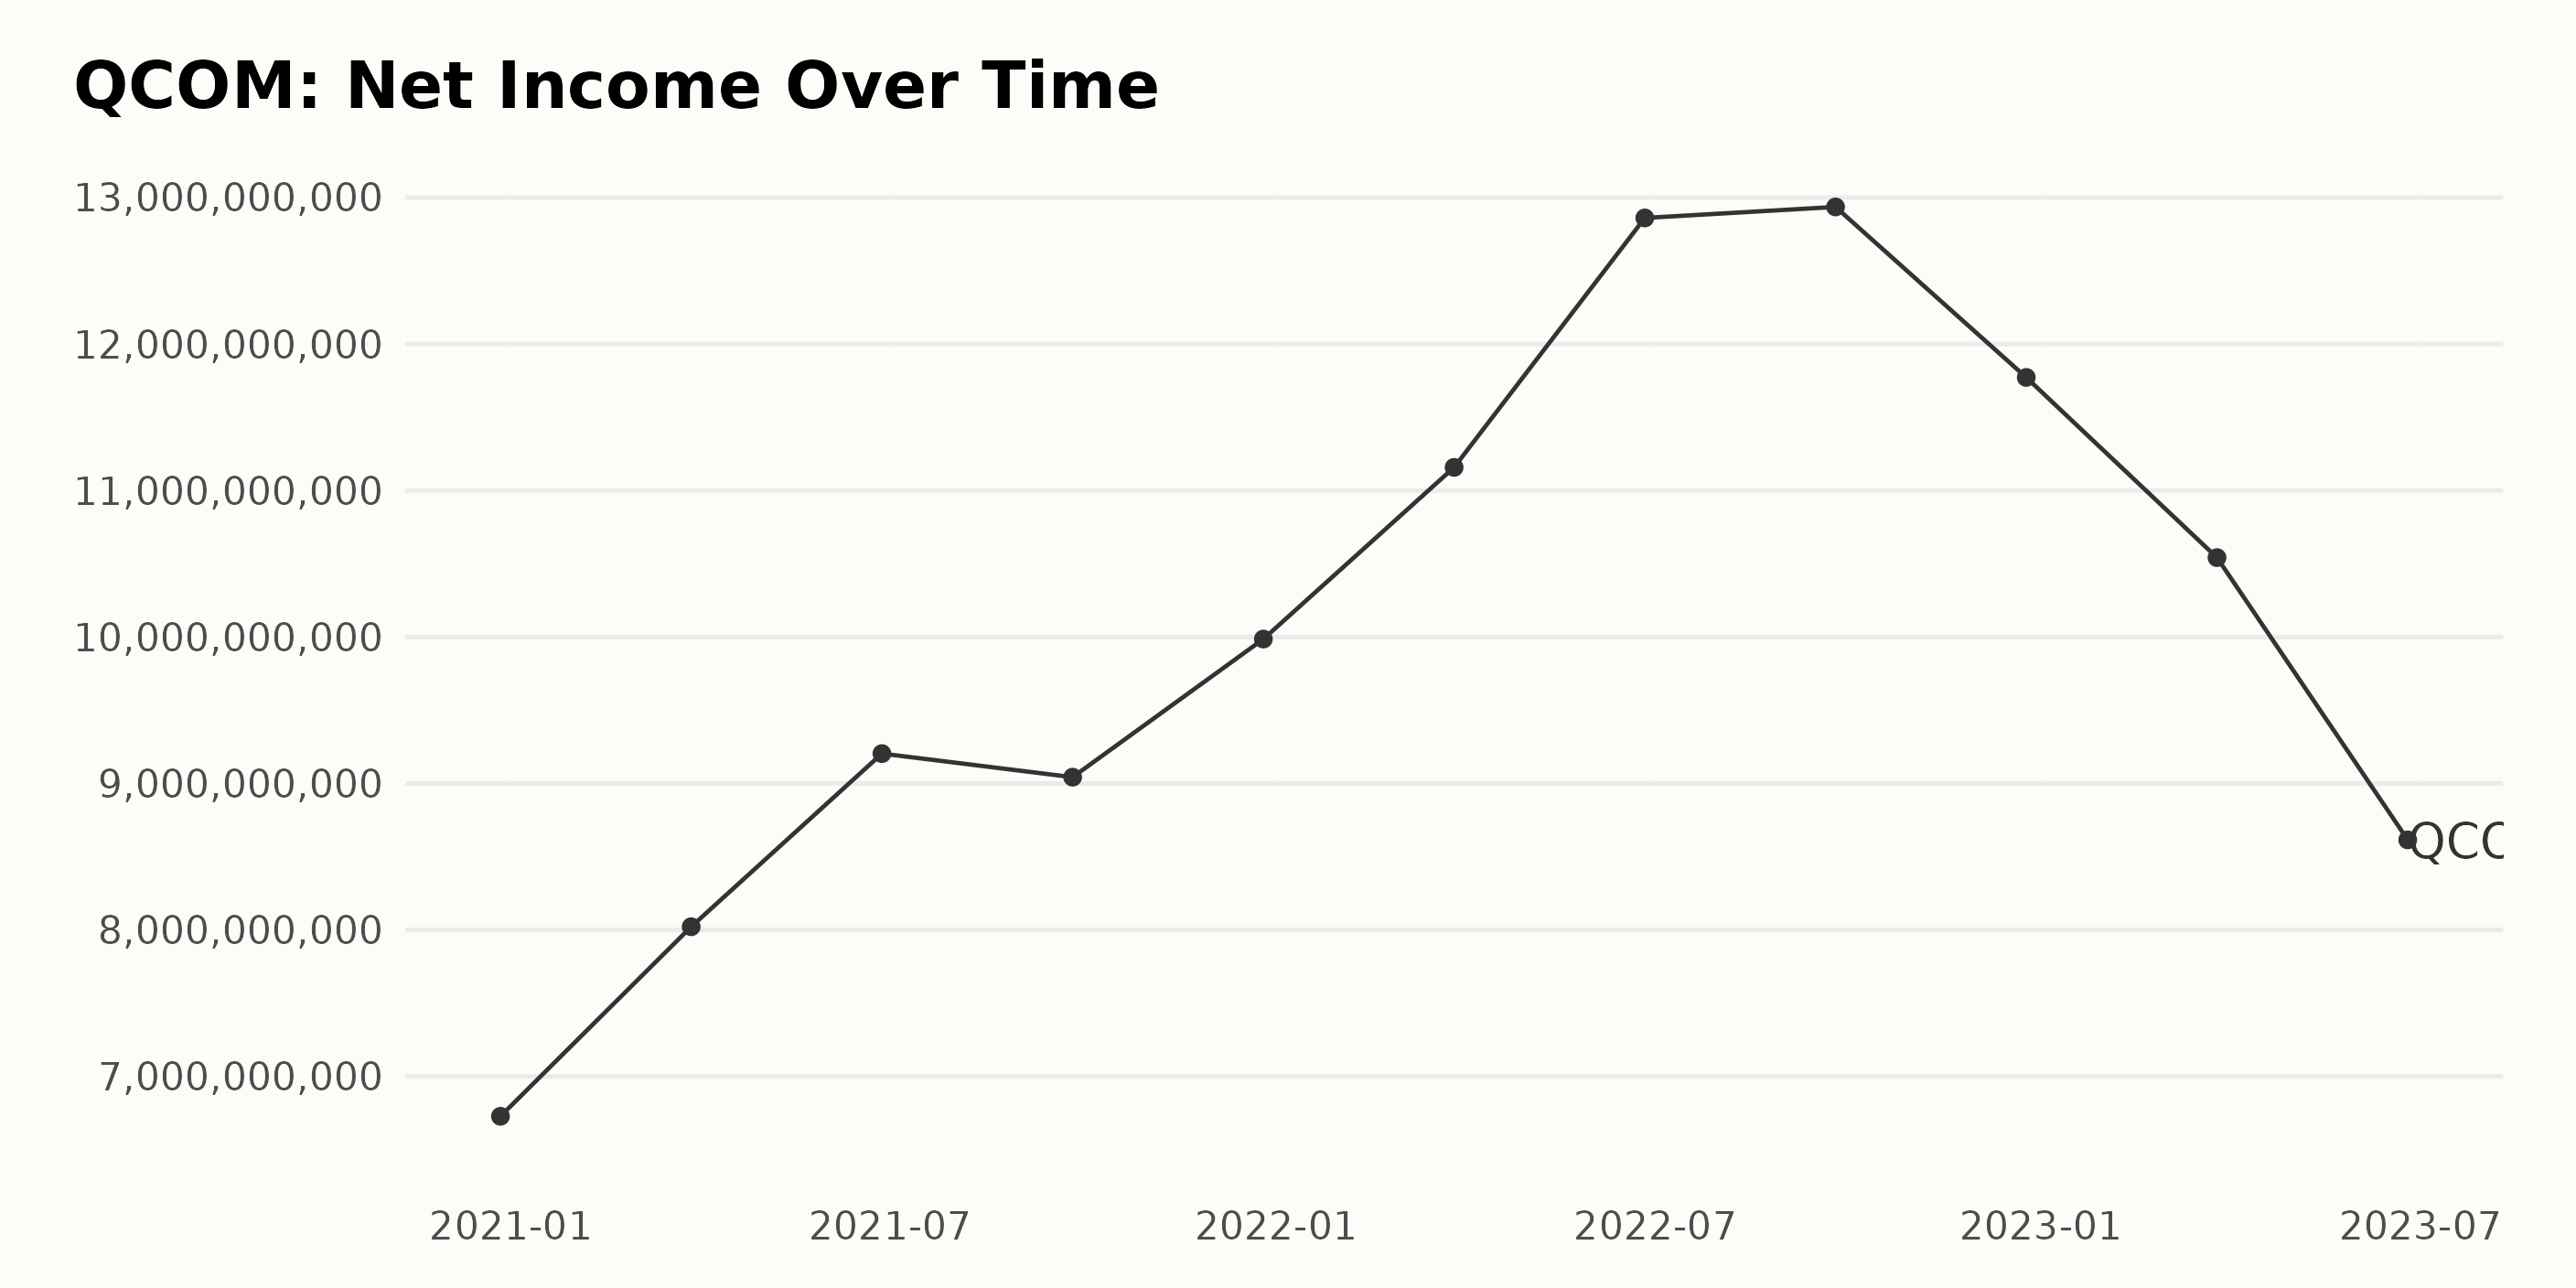
The trend and fluctuations in the trailing-12-month net income of QCOM over the observed period are as follows:
- The net income in December 2020 stood at $6.73 billion.
- A consistent quarterly growth was noticed until September 2022, reaching its peak at $12.94 billion.
- In the subsequent quarters, a decline in net income was observed, with the value decreasing to $8.62 billion in June 2023.
Focusing on more recent data and the final value in the series:
- December 2022 reported a net income of $11.77 billion for QCOM.
- This declined further to $10.54 billion in March 2023.
- The latest figure, from June 2023, stands at $8.62 billion, the lowest in this interval.
The growth rate from the first value ($6.73 billion in December 2020) to the last value ($8.62 billion in June 2023) shows an increase of 28%. However, it is important to consider the peak in September 2022 and the subsequent decrease in net income.
The following narrative details the trailing-12-month revenue trends and fluctuations for QCOM over a three-year period:
- At the end of December 2020, QCOM's revenue stood at $26.69 billion.
- By March 2021, it increased to $29.41 billion, marking a growth trend in the first quarter of 2021.
- In June 2021, the company reported a further uptick in revenue to $32.58 billion, suggesting a continuous rise in the first half of the year.
- However, the rise became rather slight by September 2021, with the revenue reaching $33.57 billion, indicating slightly slower growth in the third quarter of 2021.
- The revenue surged again to attain $36.04 billion by December 2021, closing the year on a high note.
- There was a marked jump in revenue in the first quarter of 2022, soaring to $39.27 billion by March 2022.
- By June 2022, the revenue grew to $42.14 billion, maintaining a sturdy upward trajectory in the first half of 2022.
- A notable surge saw the Revenue climax to $44.2 billion by the end of September 2022, marking the peak of QCOM's earnings within the reported period.
- Unexpectedly, there was a drop to $42.96 billion in revenue by December 2022, reversing the previous upward trend.
- This downward swing continued into 2023, with revenue falling to $41.07 billion by March 2023.
- As of the last reported date, in June 2023, the revenue dropped to $38.58 billion, marking a decline from the peak by the end of the third quarter of 2022.
To calculate the growth rate, we measure the last value ($38.58 billion in June 2023) from the first value ($26.69 billion in December 2020). Despite the recent downward trend, this reveals significant overall growth over the three-year period.

The data series reflects the trend and fluctuations in the Gross Margin of QCOM over a period of time.
- On December 27, 2020, the Gross Margin for QCOM was 60.2%.
- By March 28, 2021, it slightly descended to 60.0%.
- Further minor decline was observed by June 27, 2021, with the Gross Margin at 59.8%.
- The significant reduction came to light by September 26, 2021, when the figure stood at 57.5%
- As of December 26, 2021, the Gross Margin showed some recovery, reaching 58.2%.
- By the end of the first quarter of 2022, on March 27, it marginally increased to 58.5%.
- In the second quarter of 2022, on June 26, the value was 58.0%, showing a small dropdown.
- The rate slightly decreased again to 57.8% in the third quarter on September 25, 2022.
- By the end of the year, on December 25, 2022, it continued to decrease, standing at 57.2%.
- Moving into 2023, on March 26, the Gross Margin further descended to 56.5%.
- The latest available data is for the second quarter of 2023, on June 25, which denotes another minor drop, bringing the Gross Margin of QCOM to 56.3%.
From the initial value of 60.2% in December 2020 to the last value of 56.3% in June 2023, there is an overall decline of 3.9% in the Gross Margin of QCOM. The trend noticeably inclines towards a gradual decrease over time, with greater reductions in recent data. Despite some minor recoveries, the Gross Margin generally fluctuated downwards.

In the period between December 27, 2020, and June 25, 2023, the Return on Assets (ROA) of QCOM showed a mixed trend and considerable fluctuations.
- Starting with an ROA of 19.6% in December 2020, it rose to 22.5% in March 2021, indicating a growth rate of 14.8%.
- The trend continued until June 2021, when the ROA increased further to 24.7%.
- Despite a momentary drop to 23.4% in September 2021, the ROA displayed an overall strengthening pattern, peaking at 29.3% in June 2022. This was the highest point within the analysis period, indicating substantial growth from the beginning of the series.
- This peak was followed by a period of decreasing ROA which fell to 24.7% in December 2022 and further to 21.7% in March 2023.
- The series ended with the ROA value of 17.5% for June 2023, marking the lowest point in the given timeline.
Given this, the overall growth rate for the period, measuring the last value (17.5%) from the first value (19.6%), is a decrease of approximately 10.7%. It is notable that while there were periods of growth early on in the timeline, the more recent data shows a sustained reduction in ROA values, which implies a declining asset efficiency for QCOM during this time.

The following points outline the observed trends and fluctuations in the Analyst Price Target of QUALCOMM Incorporated (QCOM):
- Starting from an Analyst Price Target of $190 in November 2021, we saw an increase to a peak of $220 by February 2022.
- However, this was followed by a general decrease in the target price. The price reached a low of $150 by November 2022 and remained stable for a few months until February 2023.
- There was a noticeable drop in May 2023 to $135, which is the lowest value seen in this series.
- The target price then rose to $140 in August 2023 and has since held steady till October 2023.
Overall, QCOM experienced a -26% change in the Analyst Price target over the timeframe, from a significant high of $220 in February 2022 down to the latest value of $140 in October 2023. The more recent data, particularly the price stabilization at $140 over the course of August-October 2023, may suggest a temporary end to previous volatility. However, barring any further details or external factors, further speculation would be beyond the scope of this analysis. We will continue to monitor future data for potential changes in this trend.

Fluctuating Fate: A Peek into QUALCOMM's Inconsistent Share Price (April-October 2023)
The share price of QCOM does not show a consistent trend but rather fluctuates over time.
- On April 6, 2023, the share price of QCOM was at $122.91.
- By April 28, 2023, the share price dropped slightly to $115.07.
- The price continued to decline in May 2023, reaching an all-time low of $104.71 by May 26, 2023. This represents an approximate decrease of 14.8% over a two-month period.
- However, in early June 2023, the price jumped back up to $114.83 and then further increased to $123.09 by June 16, 2023, marking approximately an 18% increase in three weeks.
- After another slight drop, by July 2023, the QCOM share price started a slight upward trend, peaking at $125.96 on August 4, 2023.
- But in mid-August, the price began to decline again, reaching a low of $110.13 by August 25, showing an approximate decline of 12.6% within three weeks.
- Starting from September until the beginning of October 2023, the share price seems to stagnate around the $110 to $113 range.
In summary, between April 2023 and October 2023, the QCOM share price has been fluctuating between lows of around $104.71 and highs of $125.96. Despite periods of increase and decrease, there doesn't seem to be a clear accelerating or decelerating trend in either direction. Here is a chart of QCOM's price over the past 180 days.

Analyzing QUALCOMM's Top Metrics: Momentum, Quality, and Value Trends
QCOM has an overall C rating, translating to a Neutral in our POWR Ratings system. It is ranked #23 out of the 90 stocks in the Semiconductor & Wireless Chip category.
Analyzing the data available, the three most noteworthy dimensions for QCOM are Momentum, Quality, and Value. These dimensions have shown the highest ratings compared to other dimensions like Growth, Sentiment, and Stability.
Momentum: - Momentum was measured at 81 in April 2023, then dropped to 78 in May 2023. - There was a significant increase to 95 in June, followed by a slight decrease to 90 in July. - September saw a drop to 71 in August 2023 before recovering marginally to 78 as of September 2023.
Quality: - The quality dimension is fairly stable, starting from 82 in April 2023, then dropping slightly to 81 in May 2023. - The rating resumed at 82 for two consecutive months, June and July 2023. - There was a subsequent increase to 85 in August 2023, which continued into September 2023.
Value: - The value dimension also showed high ratings. With 81 in April 2023, it increased to 84 in May 2023 and then decreased slightly to 83 in June 2023. - In July 2023, it rose again to 85, which remained constant through August and September 2023.
In conclusion, the Momentum, Quality, and Value dimensions have proven to be the most relevant for QCOM, showcasing strength in investment value and consistent quality over time. However, it's essential to note the fluctuation in momentum, a factor investors might want to consider.

How does QUALCOMM Incorporated (QCOM) Stack Up Against its Peers?
Other stocks in the Semiconductor & Wireless Chip sector that may be worth considering are Renesas Electronics Corporation (RNECF), Everspin Technologies Inc. (MRAM), and STMicroelectronics N.V. (STM) -- they have better POWR Ratings.
What To Do Next?
Get your hands on this special report with 3 low priced companies with tremendous upside potential even in today’s volatile markets:
3 Stocks to DOUBLE This Year >
QCOM shares were trading at $110.05 per share on Tuesday afternoon, down $1.05 (-0.95%). Year-to-date, QCOM has gained 2.13%, versus a 11.18% rise in the benchmark S&P 500 index during the same period.
About the Author: Subhasree Kar

Subhasree’s keen interest in financial instruments led her to pursue a career as an investment analyst. After earning a Master’s degree in Economics, she gained knowledge of equity research and portfolio management at Finlatics.
The post Qualcomm (QCOM): Software Stock Buy or Sell for October? appeared first on StockNews.com